Water, cooling, and permitting are emerging as binding constraints alongside electricity—reshaping where AI and large-scale digital infrastructure can be built, how quickly, and at what risk.
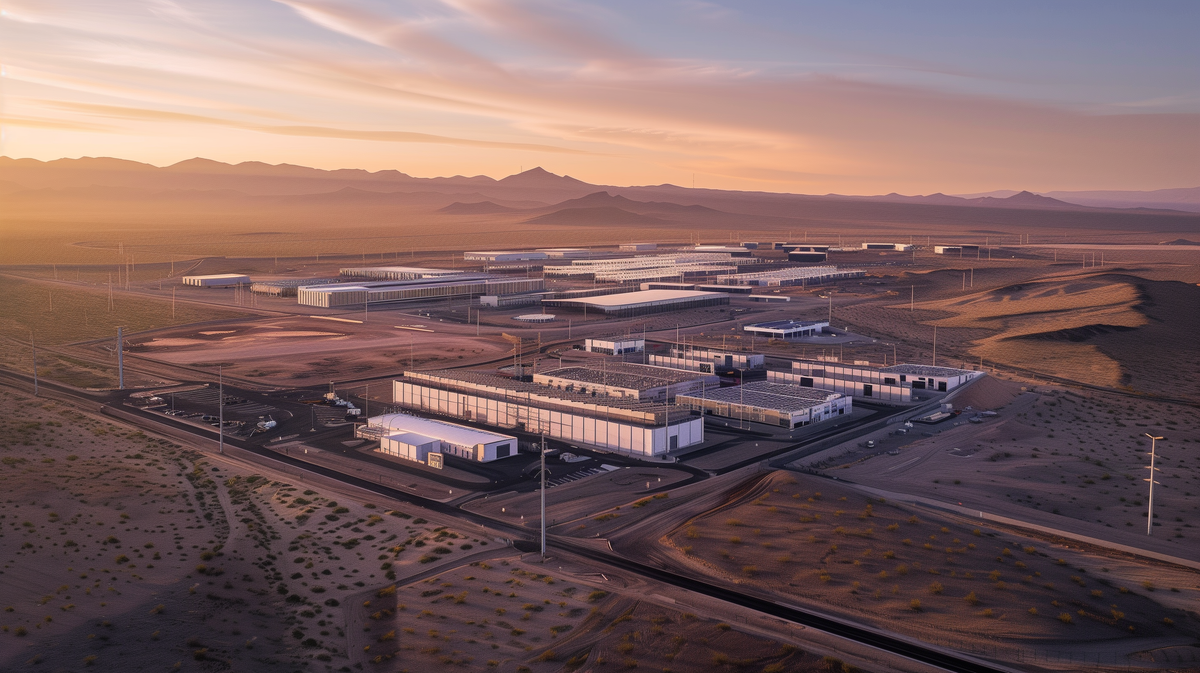
When Amazon advanced plans for a 500 MW hyperscale data center, the development team anticipated familiar challenges: securing power supply, finalizing cooling system design, and obtaining local permits. Yet as the project moved forward, a different pattern emerged. The site had been selected, land secured, and a high-efficiency design in place, including a low PUE and advanced cooling architecture. But the schedule began to slip. Interconnection studies stretched from months into years as grid operators struggled to accommodate large new loads. At the same time, local authorities required additional reviews of water sourcing, including proof of long-term supply and restrictions on potable water use. What had once been parallel workstreams became sequential bottlenecks.
The experience exposed a shift in how infrastructure projects succeed or fail. The traditional model—secure power, design cooling, obtain permits—no longer captures the reality on the ground. Large-scale data center projects now face multiple binding constraints at once, from transmission capacity to water availability to local governance. These constraints are not resolved independently. They stack, interact, and delay one another. In this environment, project viability depends not just on technical design, but on the ability to navigate a full “constraint stack” without losing time.
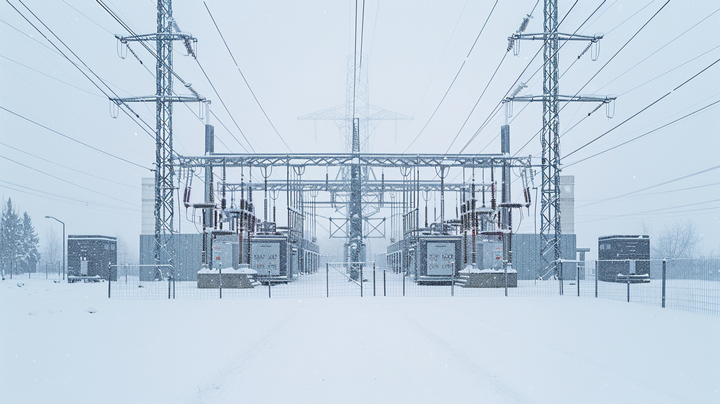
Fundamentally, the power system remains anchored in physical reality. Large infrastructure, transmission bottlenecks, fuel supply chains, and geopolitics still determine how electricity moves and at what cost. But the system is no longer moving at the same speed as the demand placed upon it. As one independent grid study observed, “in PJM it is now taking eight years to bring new generation online” (RMI 2025)—far longer than the two to three years it takes to build a data center (IEA 2025). The imbalance is structural, not temporary.
At the same time, electricity demand is accelerating at a pace the system was not designed to absorb. U.S. data centers already account for roughly 4.4 percent of national electricity consumption in 2024, up from 1.9 percent in 2018, and are growing at an estimated 12–15 percent annually (ELI 2025). Globally, data center demand could approach 945 TWh by 2030—nearly doubling within a decade (IEA 2025). These are not marginal increases. They represent a step change in load growth layered onto an infrastructure base that expands slowly and unevenly.
Individually, each pressure—rising load, constrained infrastructure, water limitations—can be managed within existing planning frameworks. Taken together, they no longer behave independently. They interact, reinforce one another, and increasingly bind at the same time. The result is not a single bottleneck, but a system defined by overlapping limits: a shift from isolated constraints to a condition of compound constraint.
Water and Cooling: A Tightening Noose
For decades, engineers treated water as effectively abundant—an input that could be secured, priced, and managed without constraining system design. That assumption is no longer reliable. Data centers reject heat continuously to keep servers within safe operating limits, and in many of today’s most efficient facilities, that heat is removed through evaporative cooling—using water to absorb heat and release it into the air as vapor. The result is a direct and unavoidable coupling between computation and water consumption.
The scale becomes clear in a representative case. A 100 MW IT load operating continuously corresponds to roughly 876 GWh per year of computing output. At a best-in-class Power Usage Effectiveness (PUE) of 1.2, total facility demand rises to about 1.05 TWh, with approximately 0.18 TWh (175 GWh) consumed by cooling and ancillary systems. Even at this level of efficiency, evaporative cooling can require on the order of 100–200 gallons of water per megawatt-hour of IT load (WUE_site ≈1–2 L/kWh_IT). Over a full year, that translates into roughly 300–600 million gallons of water consumed on site for a single 100 MW facility.
But the on-site footprint captures only part of the system. Electricity itself carries a water cost. Large thermoelectric power plants—coal, nuclear, and many gas units—depend on water for cooling and routinely consume hundreds to thousands of gallons per megawatt-hour of generation (Macknick et al. 2012). By contrast, wind and solar require almost no operational water, while certain thermal technologies, including coal and concentrated solar power with cooling towers, can exceed 800–1,000 gallons per megawatt-hour (approximately 3–4 L/kWh). The implication is straightforward but often overlooked: two identical data centers can have dramatically different total water footprints depending on the generation mix that supplies them.
When upstream electricity is included, total water intensity (WUE_source) can rise to roughly 3–5 L per kWh of IT load—effectively multiplying the apparent footprint of the facility. At system scale, the numbers become difficult to ignore. One analysis found that supporting Arizona’s projected data center expansion could require power-sector water use to increase fourfold, to roughly 14.5 billion gallons per year—enough to supply approximately 50,000 homes (Wheeler 2026).
In practical terms, the water required to sustain large-scale computing is no longer marginal. It routinely reaches hundreds of millions to more than a billion gallons per facility each year, with daily withdrawal and consumption patterns that can strain local supplies. What was once a secondary input has become a determining factor—one that directly shapes siting, permitting, and the pace at which infrastructure can be built.
The choice of cooling technology imposes a hard, unavoidable tradeoff. Evaporative (wet) cooling systems and ambient-air economizers improve energy efficiency—often reducing cooling electricity demand by 10–20 percent—but they do so by consuming large volumes of water. Air-cooled (dry) systems invert that equation. They use little to no water, but typically incur a 5–15 percent energy penalty, pushing PUE into the 1.3–1.4 range and reducing performance during periods of extreme heat. Hybrid systems sit between these poles, shifting operating modes based on temperature and water availability.
Operators understand this tradeoff clearly. As one analysis notes, “evaporative cooling is significantly more energy efficient than air cooling but requires much more water use… data centers often prefer to use mostly evaporative cooling” (Good and Neumann 2026). In practice, many hyperscale facilities target PUE values in the 1.2–1.3 range, accepting on-site water use on the order of 1–2 L per kWh of IT load to minimize electricity demand. But that preference is conditional. Where water becomes scarce, constrained, or politically contested, the calculus reverses. Developers shift toward air cooling, accepting higher energy consumption and greater dependence on grid capacity.
This is not a linear substitution. Every incremental increase in energy use propagates through the system—raising total load, increasing waste heat, tightening reserve margins, and in many regions, increasing upstream water consumption at thermoelectric power plants. A decision made at the facility level can therefore amplify constraints at the system level. In water-stressed regions such as Arizona and Nevada, this dynamic is already visible: more than 90 percent of data centers rely on minimal or no evaporative cooling precisely because water availability is binding (Wheeler 2026).
Understanding “water use” in this context requires expanding the boundary of analysis. Direct consumption at the data center is only part of the story. U.S. data centers consumed approximately 66 billion liters of water on site in 2023, down from about 79 billion liters in 2014 as some operators shifted toward air-cooled designs (ELI 2025). But their indirect footprint—embedded in electricity generation and supply chains—approaches 800 billion liters.
The distinction matters. What appears to be a reduction in on-site water use can, under certain grid conditions, reappear upstream. The system does not eliminate the constraint. It moves it.
|
Cooling
Strategy |
PUE
(approx.) |
WUE_site
(L/kWh_IT) |
|
Evaporative (cooling tower) |
1.15
– 1.25 |
~1.5 |
|
Hybrid (evap + air) |
1.20
– 1.30 |
~0.8 |
|
Air-cooled (dry) |
1.30
– 1.40 |
~0.0 |
Table: Illustrative tradeoff between energy efficiency (PUE) and water intensity (WUE) for different data center cooling strategies (typical ranges) (ELI 2025).
Interconnection and Permitting: Unseen Timelines
Beyond on-site technology, projects now confront a different class of constraint—time. These are delays that rarely appear in planning models but increasingly determine whether projects move forward at all. The most visible of these is the grid interconnection queue. Across the United States, developers face multi-year waits to connect new load or generation. The scale of the backlog has surged: queued capacity has grown from roughly 1,400 GW in 2021 to more than 2,000 GW by 2024, while average wait times have stretched beyond four years and are approaching five in many regions. In PJM—the corridor that anchors much of the country’s data center growth—it now takes on the order of eight years to bring new generation online, even as capacity markets continue to operate on three-year forward cycles. The mismatch is stark. In practical terms, developers must assume that any new power they depend on will not be fully available for half a decade or longer.
Permitting introduces a second layer of uncertainty—less visible, but often more decisive. Jurisdictions that once approved infrastructure as a matter of course are shifting toward case-by-case review. In Loudoun County, Virginia—the world’s largest concentration of data centers—officials voted in 2025 to eliminate by-right zoning for new facilities. Projects that previously moved administratively must now pass through staff evaluation, public hearings, and commission approval. In Arizona, several Phoenix-area municipalities have imposed strict water requirements, including usage caps and, in some cases, temporary moratoria, forcing developers to demonstrate secure supplemental water supplies before construction can proceed (Wheeler 2026).
These constraints are no longer theoretical. They are reshaping projects in real time. In Tucson, a proposed hyperscale facility—“Project Blue”—was halted after local opposition centered on water use. The developer ultimately abandoned evaporative cooling and sought approval in a more remote jurisdiction. The technology did not change because of engineering limits. It changed because the permitting environment made the original design untenable.
Taken together, interconnection delays and permitting uncertainty introduce a new form of system risk: not whether infrastructure can be built, but whether it can be built on time. In a sector defined by capital intensity and rapid demand growth, timing is no longer a secondary consideration. It is a binding constraint.
The Multi-Constraint Framework
The timeline misalignment is not incremental. It is structural. High-technology infrastructure now moves on a different clock than the systems that support it. A hyperscale data center can be sited, financed, and constructed within one to two years. The surrounding infrastructure—generation, transmission, permitting, and interconnection—often requires multiples of that. As the International Energy Agency notes, “a data centre can be operational in two to three years, [while] the broader energy system requires longer lead times to schedule and build infrastructure” (IEA 2025). The result is a widening temporal gap between demand formation and system readiness.
That gap defines the new operating environment. Even when a developer secures land, water access, and local approvals, the project may stall while waiting for electrical infrastructure to catch up. Capital is committed. Demand is real. But the system cannot respond on the same timeline. What appears, on paper, to be a viable project becomes, in practice, a delayed or stranded asset.
To understand this shift, it is useful to frame the problem not as a series of independent hurdles, but as an integrated system of interacting constraints. Four dimensions now govern feasibility:
1. Resource Constraints (Power and Water)
Electricity remains the dominant input, but water has emerged as a co-equal constraint. Availability is not binary; it is location-specific, seasonally variable, and politically mediated. A site with ample power but insufficient water—or vice versa—fails the feasibility test.
2. Technology Constraints (Cooling Pathways)
Cooling architecture determines how resource constraints are expressed. Evaporative systems trade water for efficiency; air-cooled systems trade efficiency for water independence. Hybrid systems introduce flexibility but not elimination of tradeoffs. Technology choices therefore reshape, but do not remove, underlying constraints.
3. Temporal Constraints (Interconnection and Permitting)
Queue delays, permitting timelines, and regulatory processes impose hard limits on when infrastructure can come online. These constraints are often inelastic. A multi-year interconnection queue or a protracted permitting process cannot be compressed through capital alone.
4. Institutional Constraints (Regulatory and Social License)
Local opposition, zoning changes, and water governance regimes increasingly determine project viability. These constraints are dynamic and non-linear. A single public hearing or policy shift can invalidate prior assumptions.
What distinguishes the current moment is not the presence of these constraints, but their interaction. They no longer operate independently. They bind simultaneously.
This creates what can be described as a multi-constraint feasibility surface. A project is viable only where all four dimensions intersect within acceptable bounds. Move outside that region—through a delay in interconnection, a tightening of water policy, or a change in cooling assumptions—and feasibility collapses.
In this environment, traditional sequential planning models are no longer sufficient. The historical approach—secure land, then power, then permits—assumes that constraints can be addressed one at a time. That assumption no longer holds. Instead, leading developers are adopting approaches drawn from advanced product development and systems engineering:
- Scenario-based siting models, which evaluate candidate locations under varying assumptions of water availability, grid timelines, and regulatory conditions
- Constraint elasticity analysis, which distinguishes between flexible constraints (e.g., cooling technology choices) and inelastic ones (e.g., aquifer limits, queue duration)
- Joint optimization frameworks, which seek solutions that satisfy multiple constraints simultaneously rather than sequentially
The shift is subtle but profound. The problem is no longer how to solve for a single limiting factor. It is how to navigate a system in which multiple limits move, interact, and reinforce one another.
Stepping back, the system itself has evolved along three dimensions: it has become more intelligent, more distributed, and more dynamic. The physical grid remains foundational, but it now operates within a broader architecture shaped by digital demand, regulatory complexity, and resource coupling. Decisions are no longer made within a single domain. They are made across domains, often with incomplete information and asymmetric timelines.
For infrastructure leaders—utilities, regulators, and developers—the implication is clear. Planning must shift from static optimization to dynamic alignment. The central question is no longer simply whether a project can be built, but whether all required systems can align in time.
This introduces a new operational metric: time-to-alignment. It captures the duration required for power, water, permitting, and technology pathways to converge at a single site. In many cases, this—not cost, not capacity—becomes the binding variable.
The practical consequences are already visible. Projects with favorable economics are delayed or relocated. Cooling strategies are redesigned late in development. Capital is deployed into sites that cannot advance on schedule. These are not isolated failures. They are signals of a system under multi-dimensional stress.
There is no universal solution. Each region presents a different configuration of constraints. But the pattern is consistent: constraints that are treated as secondary in early planning stages re-emerge as primary risks later. What is not modeled upfront becomes binding in execution.
Infrastructure leaders are beginning to adapt. Water availability, regulatory timelines, and load characteristics are moving earlier in the decision process. Scenario modeling is replacing deterministic forecasts. Cross-disciplinary teams—engineering, policy, finance—are converging around shared analytical frameworks.
The transition is still incomplete. But the direction is clear. The system is entering an era of interlocking constraints, where feasibility is defined not by any single factor, but by the alignment of many. Those who recognize this shift are beginning to build accordingly. Those who do not risk designing projects that cannot be realized within the systems they depend on.
References
Enkiai Research. “Grid Interconnection Delays 2026: A Threat to US Energy.” 2026. https://enkiai.com/ai-market-intelligence/grid-interconnection-delays-2026-a-threat-to-us-energy.
Environmental Law Institute. “AI’s Cooling Problem: How Data Centers Are Transforming Water Use.” Vibrant Environment Blog, October 23, 2025. https://www.eli.org/vibrant-environment-blog/ais-cooling-problem-how-data-centers-are-transforming-water-use.
Good, Maggie, and Johanna Neumann. “Does Virginia Have Enough Water to Quench Thirsty Data Centers?” Frontier Group, March 10, 2026. https://frontiergroup.org/articles/does-virginia-have-enough-water-to-quench-thirsty-data-centers/.
International Energy Agency. Energy and AI: Energy Demand from Artificial Intelligence. 2025. https://www.iea.org/reports/energy-and-ai/energy-demand-from-ai.
Macknick, Jordan, Robin Newmark, Garvin Heath, and KC Hallett. Review of Operational Water Consumption and Withdrawal Factors for Electricity Generating Technologies. Golden, CO: National Renewable Energy Laboratory, 2012. https://docs.nrel.gov/docs/fy11osti/50900.pdf.
MultiState Associates. “State Data Center Legislation Faces Local Zoning Battles.” January 15, 2026. https://www.multistate.us/insider/2026/1/15/state-data-center-legislation-faces-local-zoning-battles.
Rocky Mountain Institute (RMI). “PJM’s Speed to Power Problem and How to Fix It.” November 4, 2025. https://rmi.org/pjms-speed-to-power-problem-and-how-to-fix-it/.
U.S. Department of Energy. Cooling Water Efficiency Opportunities for Federal Data Centers. Federal Energy Management Program (FEMP). https://www.energy.gov/cmei/femp/cooling-water-efficiency-opportunities-federal-data-centers.
Wheeler, David. “Arizona’s Water Is Drying Up. That’s Not Stopping the Data Centre Rush.” The Energy Mix, March 11, 2026. https://www.theenergymix.com/arizonas-water-is-drying-up-thats-not-stopping-the-data-centre-rush/.