AI is spreading across electric utilities, but most projects stall. The problem isn’t the algorithms—it’s the data. Grid systems operate on different clocks, from milliseconds to days. Until utilities build time-synchronized data architectures, AI will remain experimental rather than operational.
At 4:37 a.m. on a winter morning in the northeastern United States, a distribution feeder experiences a rapid voltage drop. A large industrial motor has started. Nearby rooftop solar inverters adjust reactive power. A voltage regulator taps upward. Within seconds the feeder stabilizes.
The event lasts less than ten seconds—one of thousands of small disturbances that occur across modern power systems every day. Yet if a utility attempted to reconstruct this moment using most enterprise data platforms, the sequence would be difficult to see.
SCADA telemetry may record voltage every four seconds. Smart meters report fifteen‑minute averages. Asset systems capture regulator changes later through maintenance logs. Telemetry from distributed energy resources may arrive through third‑party aggregators minutes afterward.
Individually, each system contains useful data. Together, they rarely produce a coherent timeline of what actually happened on the grid. This engineering problem sits at the center of one of the power sector’s most ambitious transitions: the deployment of artificial intelligence in grid operations.
Utilities across North America and Europe are investing heavily in machine‑learning systems designed to predict equipment failures, forecast distributed solar output, optimize voltage profiles, and prioritize outage restoration. Vendors promote “AI‑enabled grid operations.” Cloud providers advertise predictive maintenance platforms and digital twins. Regulators increasingly ask how artificial intelligence might improve reliability or reduce costs.
Yet inside many utilities the outcome is more modest. Most AI initiatives remain pilot projects. The barrier is rarely the algorithms. The real constraint is something more basic: utility data architecture.
A Grid That Speaks in Many Clocks
Figure 1: The Utility Time Problem
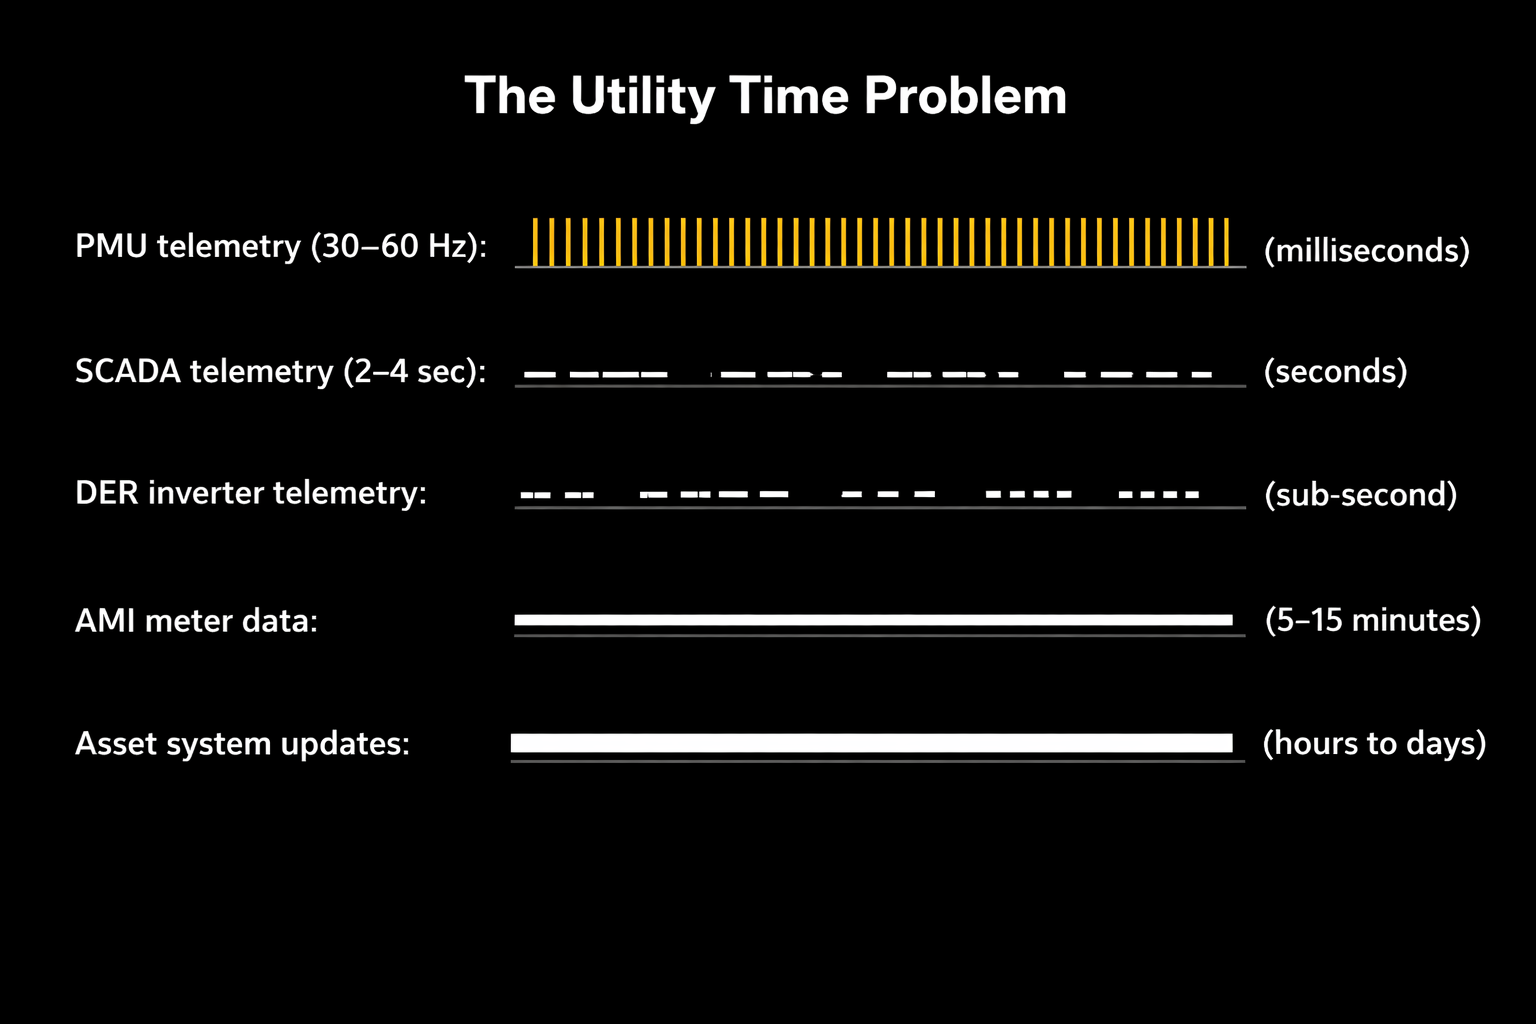
Electric utilities operate one of the most complex data ecosystems in modern infrastructure. Every part of the grid produces information—but those signals arrive on very different time scales.
Transmission SCADA systems typically report measurements every two to four seconds. Phasor measurement units capture waveform dynamics thirty to sixty times per second. Distribution automation devices generate asynchronous events. Smart meters record consumption at fifteen‑minute intervals. Asset management systems update only when maintenance work is completed.
Each platform maintains its own clock, data model, and communication protocol. From the perspective of an AI system attempting to interpret grid behavior, the result is a landscape of competing clocks. The physical grid evolves continuously. The digital systems observing it do not.
A System Built in Layers
The modern utility data environment reflects decades of incremental modernization rather than a unified design.
For much of the twentieth century, operators relied primarily on SCADA telemetry from substations and transmission assets. Distribution systems were largely invisible beyond outage reports.
Beginning in the 1990s utilities deployed new digital platforms: geographic information systems to map network topology, enterprise asset‑management tools to track equipment life cycles, outage management systems to coordinate restoration, and later advanced metering infrastructure generating granular consumption data from millions of customers.
More recently utilities added distributed‑energy resource management systems, advanced distribution management systems, and market platforms. Each system improved visibility within its own operational domain. Few were designed to operate as components of a unified data architecture. Data typically moves between them through periodic extracts or custom integrations. Over time this produced what many engineers recognize as an infrastructure of loosely connected digital islands.
The Data Lake Detour
Over the past decade many utilities attempted to address this fragmentation by building enterprise data lakes.
Inspired by the technology sector, organizations centralized operational data into large storage platforms built on Hadoop clusters or cloud environments such as Azure Data Lake or Amazon S3.
The promise was simple: collect all enterprise data in one place and enable advanced analytics. In practice most utility data lakes became repositories for historical reporting rather than engines of operational intelligence.
The problem lies in how these systems ingest information. Data lakes typically rely on batch pipelines: SCADA exports every few minutes, meter data arrives nightly, and asset systems synchronize periodically. Batch ingestion degrades the temporal fidelity of grid data.
A feeder switching event recorded at 14:02:11, a voltage disturbance captured at 14:02:13, and inverter responses occurring milliseconds later may all appear in the same dataset—but without reliable ordering. For machine‑learning systems attempting to infer cause and effect, that loss of sequence erases the physics of the event.
The Grid as a Time‑Series Infrastructure
Power systems are fundamentally time‑series infrastructures. Frequency, voltage, line loading, and generation output evolve continuously. Disturbances propagate rapidly through electrical networks. Transmission faults may clear within cycles of the electrical waveform. Distribution voltage events travel across feeders within seconds.
Understanding these dynamics requires aligning multiple streams of time‑stamped information, including:
SCADA telemetry;
Phasor measurement unit data;
Protection relay triggers;
Feeder switching events;
Distributed inverter telemetry;
Weather observations; and
Market dispatch signals.
When these signals are synchronized, the behavior of the grid becomes transparent. When they are not, the system becomes opaque. The challenge is therefore not simply collecting data but constructing a temporal architecture capable of aligning it.
Toward a Utility Data Mesh
Figure 2: Utility Data Lake vs. Data Mesh Architecture
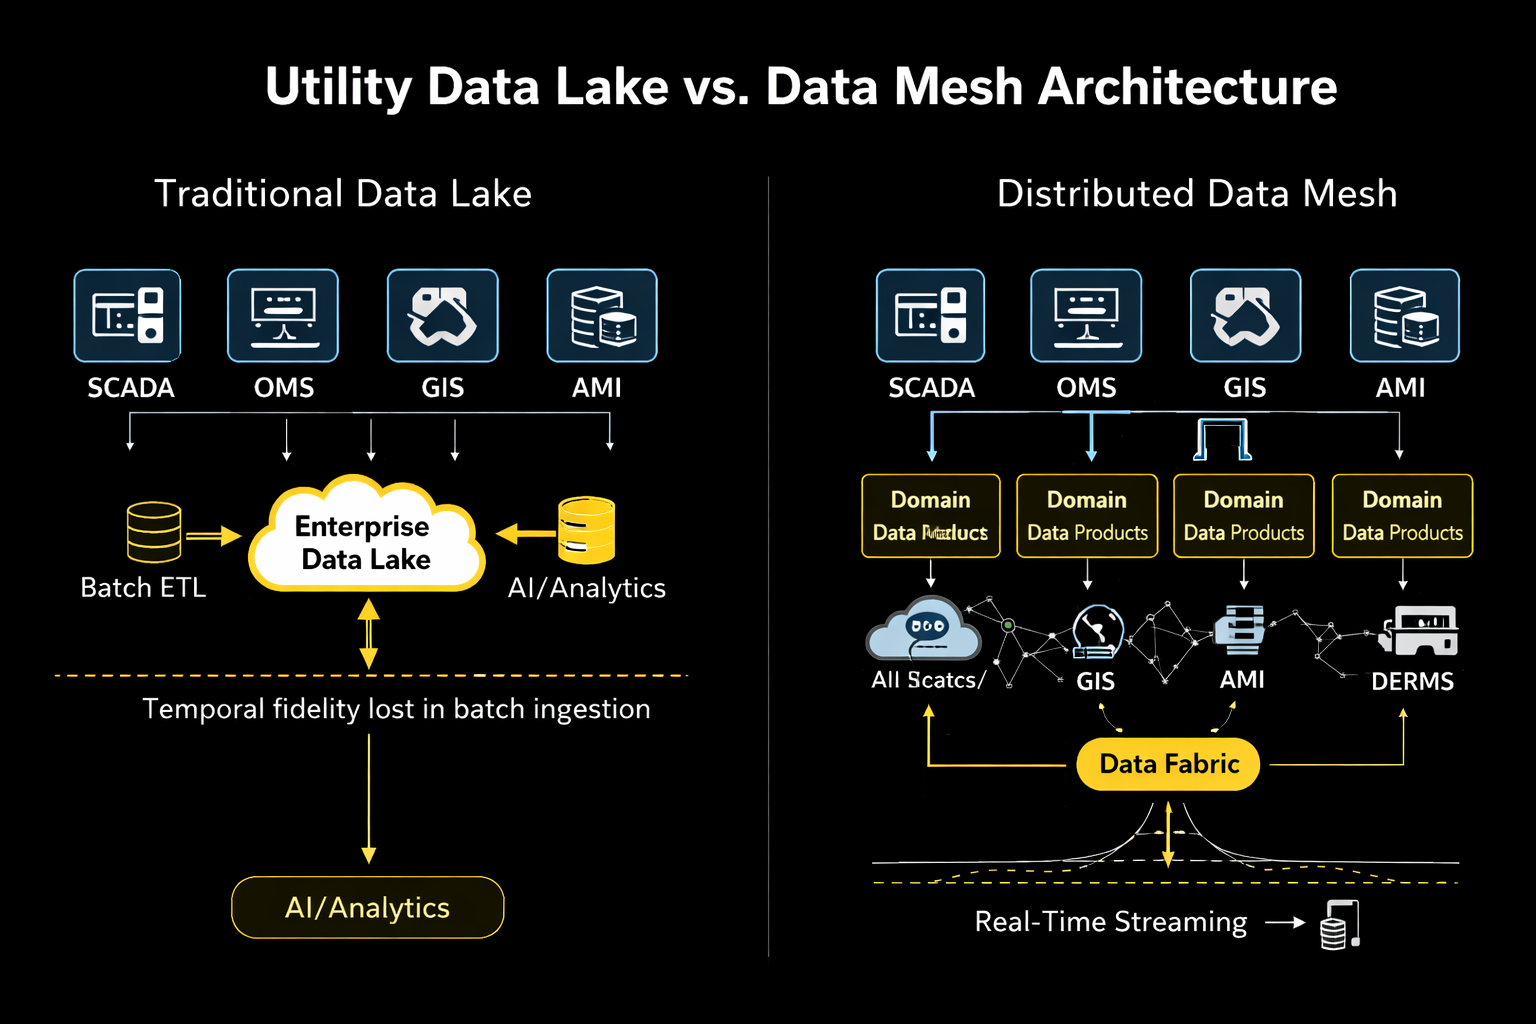
A growing number of industries facing similar challenges have adopted a different architectural approach known as the data mesh. Instead of centralizing all enterprise data, the mesh treats each operational domain as the steward of its own data products. Transmission operations publish telemetry streams. Distribution engineering provides feeder topology and switching events. Asset teams maintain equipment‑health datasets. Customer systems expose demand and consumption signals.
These data products become accessible through standardized interfaces while remaining close to their operational sources. For utilities, this model preserves the integrity of operational systems while enabling enterprise analytics. Machine‑learning systems subscribe directly to domain data products rather than extracting static datasets.
Streaming the Grid
Figure 3: Time‑Synchronized Grid Data Pipeline
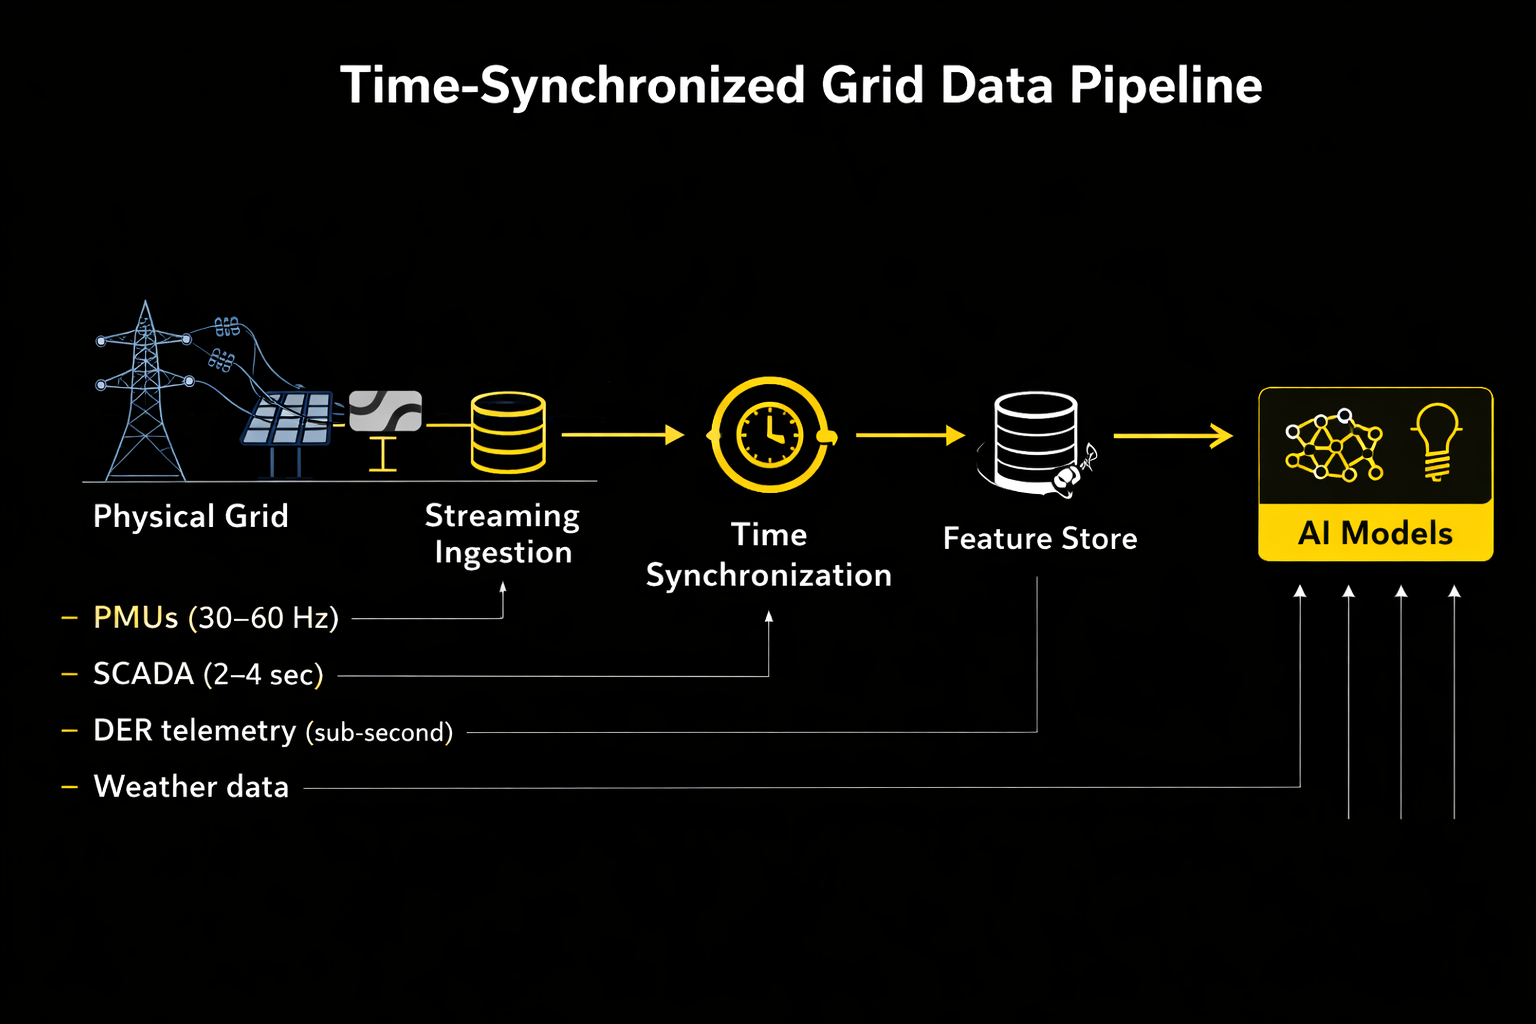
The technical foundation for this architecture is streaming telemetry. Industrial data platforms increasingly use message‑streaming systems to ingest operational events in real time. Voltage measurements, switching actions, inverter responses, and sensor data flow continuously through a shared pipeline where timestamps are aligned and enriched with metadata.
Time‑series databases store high‑resolution telemetry while feature stores prepare data for machine‑learning inference. Predictive models can then operate continuously rather than on periodic extracts. A transformer health model evaluates loading data and weather conditions in real time. A voltage optimization system monitors inverter telemetry and feeder conditions. Grid analytics becomes continuous operational intelligence rather than periodic reporting.
Digital Twins and Real‑Time Models
Once synchronized data streams exist, utilities can construct operational digital twins—computational models that mirror the state of the grid as telemetry arrives.
Unlike traditional planning models, these twins update continuously. Engineers can simulate switching actions, dispatch distributed batteries, or evaluate voltage adjustments under current conditions.
Machine learning can enhance these models by forecasting load or distributed generation behavior. But digital twins depend critically on synchronized data pipelines. If telemetry arrives with inconsistent timestamps or missing events, the simulated grid quickly diverges from the physical one.
Integrating Distributed Energy
Synchronization challenges intensify as distributed energy resources proliferate. Millions of rooftop solar systems, batteries, and electric vehicles now interact with distribution networks. Many communicate through third‑party aggregators using internet protocols rather than traditional utility telemetry systems.
DER management platforms attempt to coordinate these resources, but the underlying data often arrives with inconsistent latency and metadata. Utilities must therefore integrate inverter telemetry, aggregator signals, and customer‑side devices into the same operational data fabric used by traditional grid systems. Without that integration, distributed energy becomes another layer of data fragmentation.
The Cybersecurity Constraint
Modern architectures must also comply with strict cybersecurity requirements. In North America, operators of the bulk electric system must follow the North American Electric Reliability Corporation’s Critical Infrastructure Protection standards.
These rules limit direct interaction between operational technology networks and corporate IT environments. As a result, utilities deploy secure data gateways between control systems and analytics platforms. Telemetry flows outward through message brokers or one‑way data diodes while preventing external commands from entering operational networks. Such segmentation allows advanced analytics without compromising reliability.
The Next Infrastructure Layer
Artificial intelligence will almost certainly become embedded in grid operations over the coming decades. The scale and volatility of modern power systems—driven by electrification, distributed generation, and climate‑driven weather extremes—demand analytical tools capable of processing vast streams of operational data.
But the decisive factor will not be the sophistication of machine‑learning models. It will be whether utilities build architectures capable of organizing grid data into coherent, time‑synchronized systems.
For most of its history the electric grid was primarily a physical infrastructure—wires, transformers, substations, and generating plants. Digital technologies gradually added layers of monitoring and automation.
Today those digital layers are becoming foundational to how the grid functions. The next stage of the grid’s evolution may hinge on something quieter but equally consequential: the ability of the system to observe itself continuously, in time, and at scale.
When that architecture exists, artificial intelligence will no longer be a pilot project or dashboard feature. It will become part of the operating logic of the grid itself.
And at that point the most important infrastructure inside a modern utility may not be generation capacity or transmission lines.
It may be the data architecture that allows the grid to understand its own behavior.
References
Davenport, Thomas H., and D. J. Patil. “Data Scientist: The Sexiest Job of the 21st Century.” Harvard Business Review 90, no. 10 (October 2012): 70–76. https://hbr.org/2012/10/data-scientist-the-sexiest-job-of-the-21st-century.
Dehghani, Zhamak. Data Mesh: Delivering Data-Driven Value at Scale. Sebastopol, CA: O’Reilly Media, 2022.
North American Electric Reliability Corporation. Critical Infrastructure Protection Reliability Standards. Atlanta: NERC. https://www.nerc.com/pa/Stand/Pages/CIPStandards.aspx.
U.S. Department of Energy. Grid Modernization Initiative. Washington, DC: U.S. Department of Energy. https://www.energy.gov/gmi/grid-modernization-initiative.