The Annual Energy Outlook has always carried authority. It does not predict; it structures. It does not claim certainty; it defines the bounds of it. For years, that distinction blurred in practice as the “Reference Case” came to stand in for a future that markets and policymakers could point to.
AEO2026 removes that comfort. It does not replace it with a new forecast. It removes the idea of a center altogether and replaces it with a framework for testing how the system behaves when its assumptions move. In doing so, it reveals a deeper shift: the U.S. energy system is no longer organized around total energy demand or fuel substitution alone. It is reorganizing around electricity—its growth, its timing, and the forces now driving it.
The comparison with AEO2025 makes that shift visible. The numbers evolve, but the structure changes more. What follows is a technical reassessment grounded in the narratives, assumptions, and reported data, with attention to where the outlook has moved in meaning as well as magnitude.
The Baseline: From “Reference Case” to Experimental Control
The most explicit methodological change between the two outlooks is definitional, and it sits at the center of how every result should be read. In AEO2025, the Reference Case is described as a policy-neutral representation of the system under laws and regulations as of December 2024, intended to reflect business-as-usual trends.¹ In AEO2026, the same construct is renamed the Counterfactual Baseline and is accompanied by a clear clarification that it should not be regarded as the most likely of the cases, but instead serves as an experimental control.²
Nothing in the underlying machinery has changed. The model still uses NEMS, still holds policy constant at a cutoff date, and still evaluates side cases around that anchor. What has changed is the interpretive center. The 2025 framing allowed the Reference Case to function as an anchor that markets and analysts treated as a central trajectory, even if that was not its stated purpose. The 2026 framing removes that anchor and replaces it with a disciplined statement about function.
This distinction reframes the entire output of the model. The results are no longer implicitly presented as a path forward, but as a structured environment for testing how the system responds when assumptions move. The outlook becomes less a projection and more a sensitivity surface, and the burden shifts to the reader to understand relationships rather than to select outcomes.
Macroeconomic Assumptions: Narrow Drift Within a Constrained Envelope
The macroeconomic assumptions across the two outlooks remain tightly bounded, but the narrative treatment in 2026 places greater emphasis on structural constraints. In AEO2025, GDP growth in the Reference Case averages 1.8 percent annually through 2050.³ In AEO2026, the Counterfactual Baseline assumes slightly lower growth at 1.7 percent annually, with side cases spanning a range from 1.2 percent to 2.2 percent.⁴
The more important shift lies in the explanation. The 2026 narrative explicitly ties slower long-term growth to demographic constraints, including population, labor force, and productivity limits, rather than treating it primarily as an economic uncertainty. Population projections reinforce this bounded outlook, ranging from 352 million to 382 million by 2050.⁵
This tighter macro envelope places greater analytical weight on technology and structural change within the energy system itself, because macroeconomic variability alone is not sufficient to drive large differences in outcomes.
Total Energy Consumption: Stability as a Structural Feature
Both outlooks converge on a consistent conclusion that total U.S. energy consumption remains effectively flat through 2050 across most scenarios. In AEO2026, total consumption trends range from declines of roughly 0.6 percent annually to near-zero growth, with only modest expansion in high-growth cases.⁶ This result is not an anomaly but an extension of a long-running pattern.
Between 2000 and 2025, total energy consumption declined slightly, even as GDP expanded at more than two percent per year, with the system operating within a narrow band of approximately 88 to 99 quadrillion BTUs.⁷ AEO2025 presents this trend as context, while AEO2026 embeds it as a defining structural condition of the system.
The implication is that efficiency gains and structural economic changes continue to offset growth across sectors. The United States is no longer an energy-growth economy in the traditional sense, and that constraint persists regardless of variation in policy or technology assumptions.
Electricity Demand: The Break from Historical Behavior
The most consequential divergence between AEO2025 and AEO2026 emerges in electricity demand, where the system departs from its prior period of stagnation. After more than a decade of flat demand, electricity consumption has increased by 2.1 percent annually over the past five years and is projected to grow between 0.9 percent and 1.6 percent per year through 2050.⁸
This renewed growth is not driven by traditional factors such as population or industrial expansion alone. AEO2026 isolates a new driver that is explicitly embedded in the model structure: data centers and AI-driven computation. The Commercial Demand Module separates data center server energy use from broader commercial consumption, allowing it to be tracked and scaled independently. The model assumes rapid expansion of installed AI server capacity, with exponential growth in the high-demand case.
The resulting magnitude is substantial. Data center electricity consumption reaches 818 billion kilowatt-hours by 2050 in the High Electricity Demand case, representing more than a sixteenfold increase from 2020 levels.⁹ Even in the baseline case, the contribution is material, and data centers combined with electric vehicles account for 50 to 80 percent of incremental electricity demand growth while representing only 10 to 25 percent of total demand.¹⁰
This asymmetry indicates that growth is no longer diffuse across the economy, but concentrated in specific technologies that operate with distinct characteristics.
Load Shape: A New Determinant of System Cost
AEO2026 elevates the importance of load shape, moving beyond total demand to consider how electricity is consumed over time. Two distinct demand profiles emerge from the analysis, each with different system implications.
Electric vehicles introduce variability by concentrating charging in specific hours, typically in the evening and overnight, which increases peak demand and drives investment in transmission and distribution infrastructure. Data centers introduce continuity by operating with a relatively constant load across all hours, raising the baseline level of demand and increasing the need for sustained generation capacity.¹¹
These differences translate directly into cost structures. Peak-driven demand requires infrastructure sized to meet short-duration maximum loads, while continuous demand requires capacity that operates at high utilization levels. In scenarios with lower EV penetration, distribution costs increase as peak demand remains high relative to total consumption. In scenarios with high data center growth, generation costs rise as capacity must expand to meet continuous load requirements.
AEO2025 does not emphasize this distinction to the same degree. In AEO2026, load shape becomes a primary analytical variable, reflecting a shift in how system planning is conceptualized.
Electricity Supply: Scaling a Continuous System
The demand shifts described above are reflected in supply-side expansion. Across all cases in AEO2026, total electricity generation increases by 25 to 50 percent by 2050, while installed capacity expands by 50 to 90 percent.¹² These increases are required not only to meet higher total demand but also to accommodate the structural characteristics of that demand.
The fuel mix evolves in a direction consistent with AEO2025 but with greater clarity in magnitude. Natural gas remains the largest single contributor at roughly 40 percent of generation in the baseline case, while wind and solar each rise to approximately 20 percent shares. Coal declines from about 16 percent in 2025 to less than one percent under policy-constrained scenarios or around five percent without those constraints. Nuclear generation remains relatively stable in absolute terms but declines in share as total generation increases.¹³
The key difference between the outlooks lies not in direction but in scale and context. Capacity expansion is increasingly driven by continuous, technology-specific demand rather than by broad-based growth across sectors.
Transportation: Efficiency and Policy Sensitivity
While electricity demand rises, transportation energy consumption continues to decline, reinforcing the decoupling between total energy use and economic activity. AEO2026 projects transportation energy use falling from 27 quadrillion BTUs in 2025 to between 21 and 25 quads by 2050, depending on policy assumptions.¹⁴
Electric vehicle adoption plays a central role in this decline. Under current policy assumptions, EVs account for 40 to 46 percent of the light-duty fleet by 2050, with zero-emission freight trucks reaching 21 to 24 percent. In the absence of those policies, EV penetration falls significantly, with light-duty share near 18 percent and freight electrification near five percent.¹⁵
These differences propagate through the system. Reduced electrification leads to increased liquid fuel demand, with potential increases of up to three million barrels per day by 2050, affecting refining activity, trade balances, and LNG exports.¹⁶ AEO2026 traces these interdependencies more explicitly than AEO2025, highlighting the system-wide implications of sector-specific changes.
Model Evolution: From Expansion to Resolution
The evolution of NEMS between the two outlooks supports these analytical shifts. AEO2025 introduced new modules for hydrogen markets, carbon capture, and hydrocarbon supply, expanding the model’s scope.¹⁷ AEO2026 focuses on improving resolution and performance, reducing runtime by more than half, decreasing disk usage, enhancing LNG modeling, and refining hourly aggregation to better capture variability in renewable generation and load.¹⁸
These improvements enable the model to represent temporal dynamics more accurately, which is necessary to analyze the effects of load shape and continuous demand introduced by data centers.
Conceptual Synthesis: Toward a Cognitive Grid
Taken together, these changes point beyond incremental system evolution toward a different organizing logic. The grid is no longer only a delivery system for energy; it is becoming the substrate for continuous, information-driven activity. The emergence of large, steady, computation-driven loads introduces a new form of system stress—one that is not defined by peaks alone but by persistent, high-baseline demand.
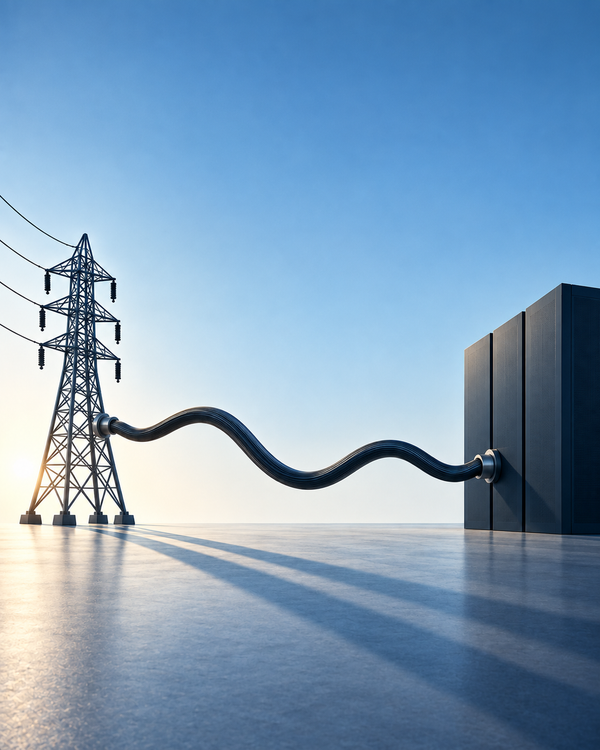
This is where the concept of a Cognitive Grid becomes useful. In this framing, electricity infrastructure and computational systems are not parallel developments but integrated layers of a single architecture. The grid supplies power to computation, while computation increasingly informs how the grid is planned, operated, and optimized. The result is a feedback loop in which energy and information systems co-evolve.
AEO2026 does not name this shift, but it provides the empirical basis for it. By isolating data center demand, quantifying its growth, and linking it to system costs through load shape, the outlook reveals the contours of a system that is no longer defined solely by energy flows, but by the interaction between energy and computation.
Final Observation
The most important change between AEO2025 and AEO2026 is not a single projection or a single case. It is the emergence of a new organizing principle in which the structure of electricity demand, including its magnitude, timing, and persistence, determines system outcomes as much as total energy consumption itself.
This principle was present in earlier outlooks but remained implicit. In AEO2026, it becomes explicit, quantified, and embedded in the model. The system is no longer evolving along the same path, and the difference is visible not in where the model points, but in how it is constructed.
Notes
- U.S. Energy Information Administration, Annual Energy Outlook 2025, narrative section.
- U.S. Energy Information Administration, Annual Energy Outlook 2026, narrative section.
- AEO2025 narrative, macroeconomic assumptions.
- AEO2026 narrative, macroeconomic assumptions.
- AEO2026 narrative, population projections.
- AEO2026 narrative, total energy consumption trends.
- AEO2026 narrative, historical energy consumption context.
- AEO2026 narrative, electricity demand growth.
- AEO2026 narrative, data center electricity consumption.
- AEO2026 narrative, share of demand growth.
- AEO2026 narrative, load shape and hourly demand discussion.
- AEO2026 narrative, generation and capacity growth.
- AEO2026 narrative, electricity fuel mix.
- AEO2026 narrative, transportation energy consumption.
- AEO2026 narrative, EV adoption rates.
- AEO2026 narrative, oil demand sensitivity.
- AEO2025 narrative, NEMS enhancements.
- AEO2026 narrative, NEMS performance and resolution improvements.