• For 283 Map campuses with a mapped pipeline, the median distance to a high-pressure gas pipeline is 5.8 km, so proximity alone does not separate sites.
• PJM’s 2028/29 auction cleared at the $325 per MW-day cap and ended 6,831 MW short of its reliability requirement.
• ERCOT has paused study and energization approvals for loads of 75 MW or more while it audits its large-load queue.
• GE Vernova is taking turbine reservations for 2031 delivery, and about a fifth of its customers are data centers.
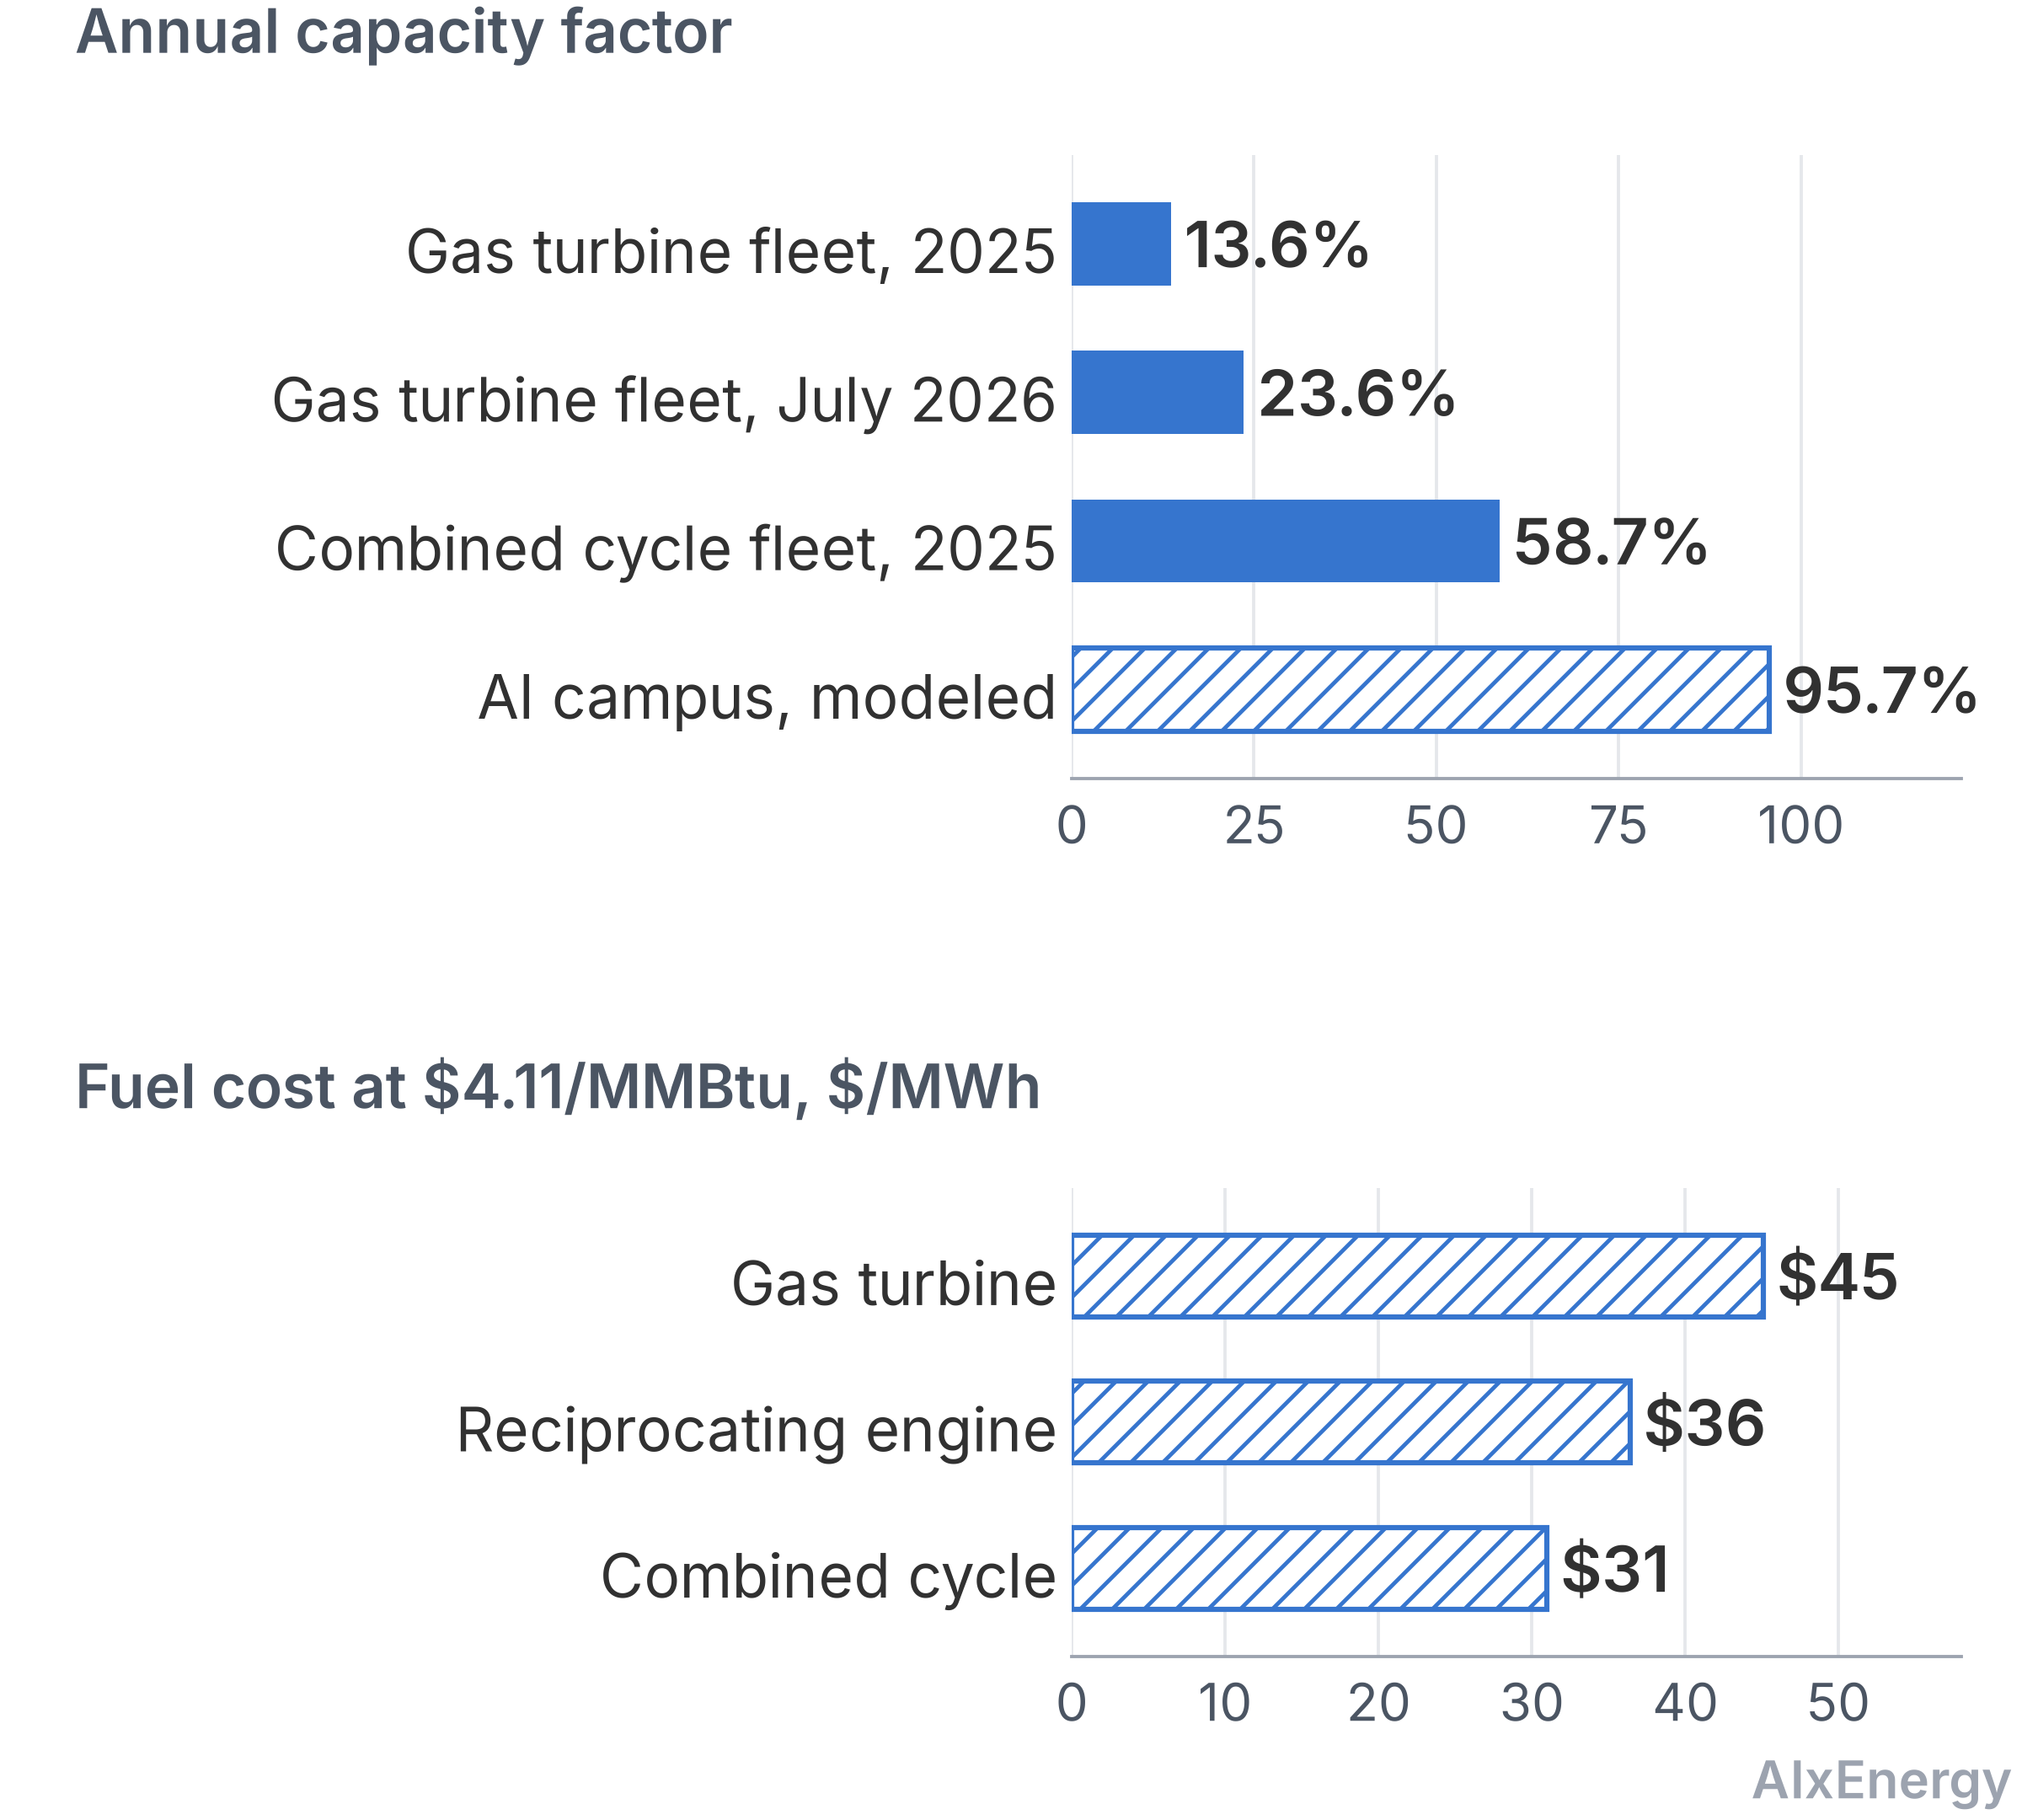
A merchant peaker is paid for a few scarce hours, and a data center pays for availability in nearly every hour. In 2025 the U.S. gas turbine fleet ran at an annual capacity factor of 13.6 percent and the combined-cycle fleet at 58.7 percent.1 The AIxEnergy Map models its Abilene campus at a load factor of 95.7 percent.2 An owner who moves a peaker toward that load changes the product it sells, and the questions that set its value shift from dispatch to deliverability, contract structure and position in several queues at once.
This article follows that shift for an independent owner of fast-start turbines at existing sites. It takes siting first, then the grid and market conditions that decide whether a site can serve firm load, and last the capital structure that decides who absorbs delay. Location arguments draw on the AIxEnergy Map, and the counts below come from the full project set, which the public preview of 50 projects does not show.3 The same equipment-slot problem is treated from the utility side in The Factory Queue Is the New Interconnection Queue,4 and the contractual side of delay in How Data Center Deals Allocate Delay Risk.5
Siting: gas access is rarely the scarce input
Nearly every announced campus already sits close to a gas pipeline, so proximity cannot be what separates one site from another. The Map holds 304 U.S. projects of 50 MW or more. Of the 287 with coordinates, 283 have a mapped high-pressure pipeline within 30 miles, and those 283 represent 146.1 GW of announced load. Their median distance to the nearest pipeline is 5.8 kilometers, with 47 percent inside 5 kilometers and 69 percent inside 10.3 The median is about 4 kilometers in ERCOT and PJM, 9 in MISO and about 10 in the western interconnection. Generation is less evenly spread: 173 campuses, carrying 56 percent of the load, have at least 1 GW of operating gas plants within about 30 miles, while 40 campuses with 26.5 GW have none.3 Figure 1 shows the pattern, and the Map's DC-associated generation scene opens the underlying layers.
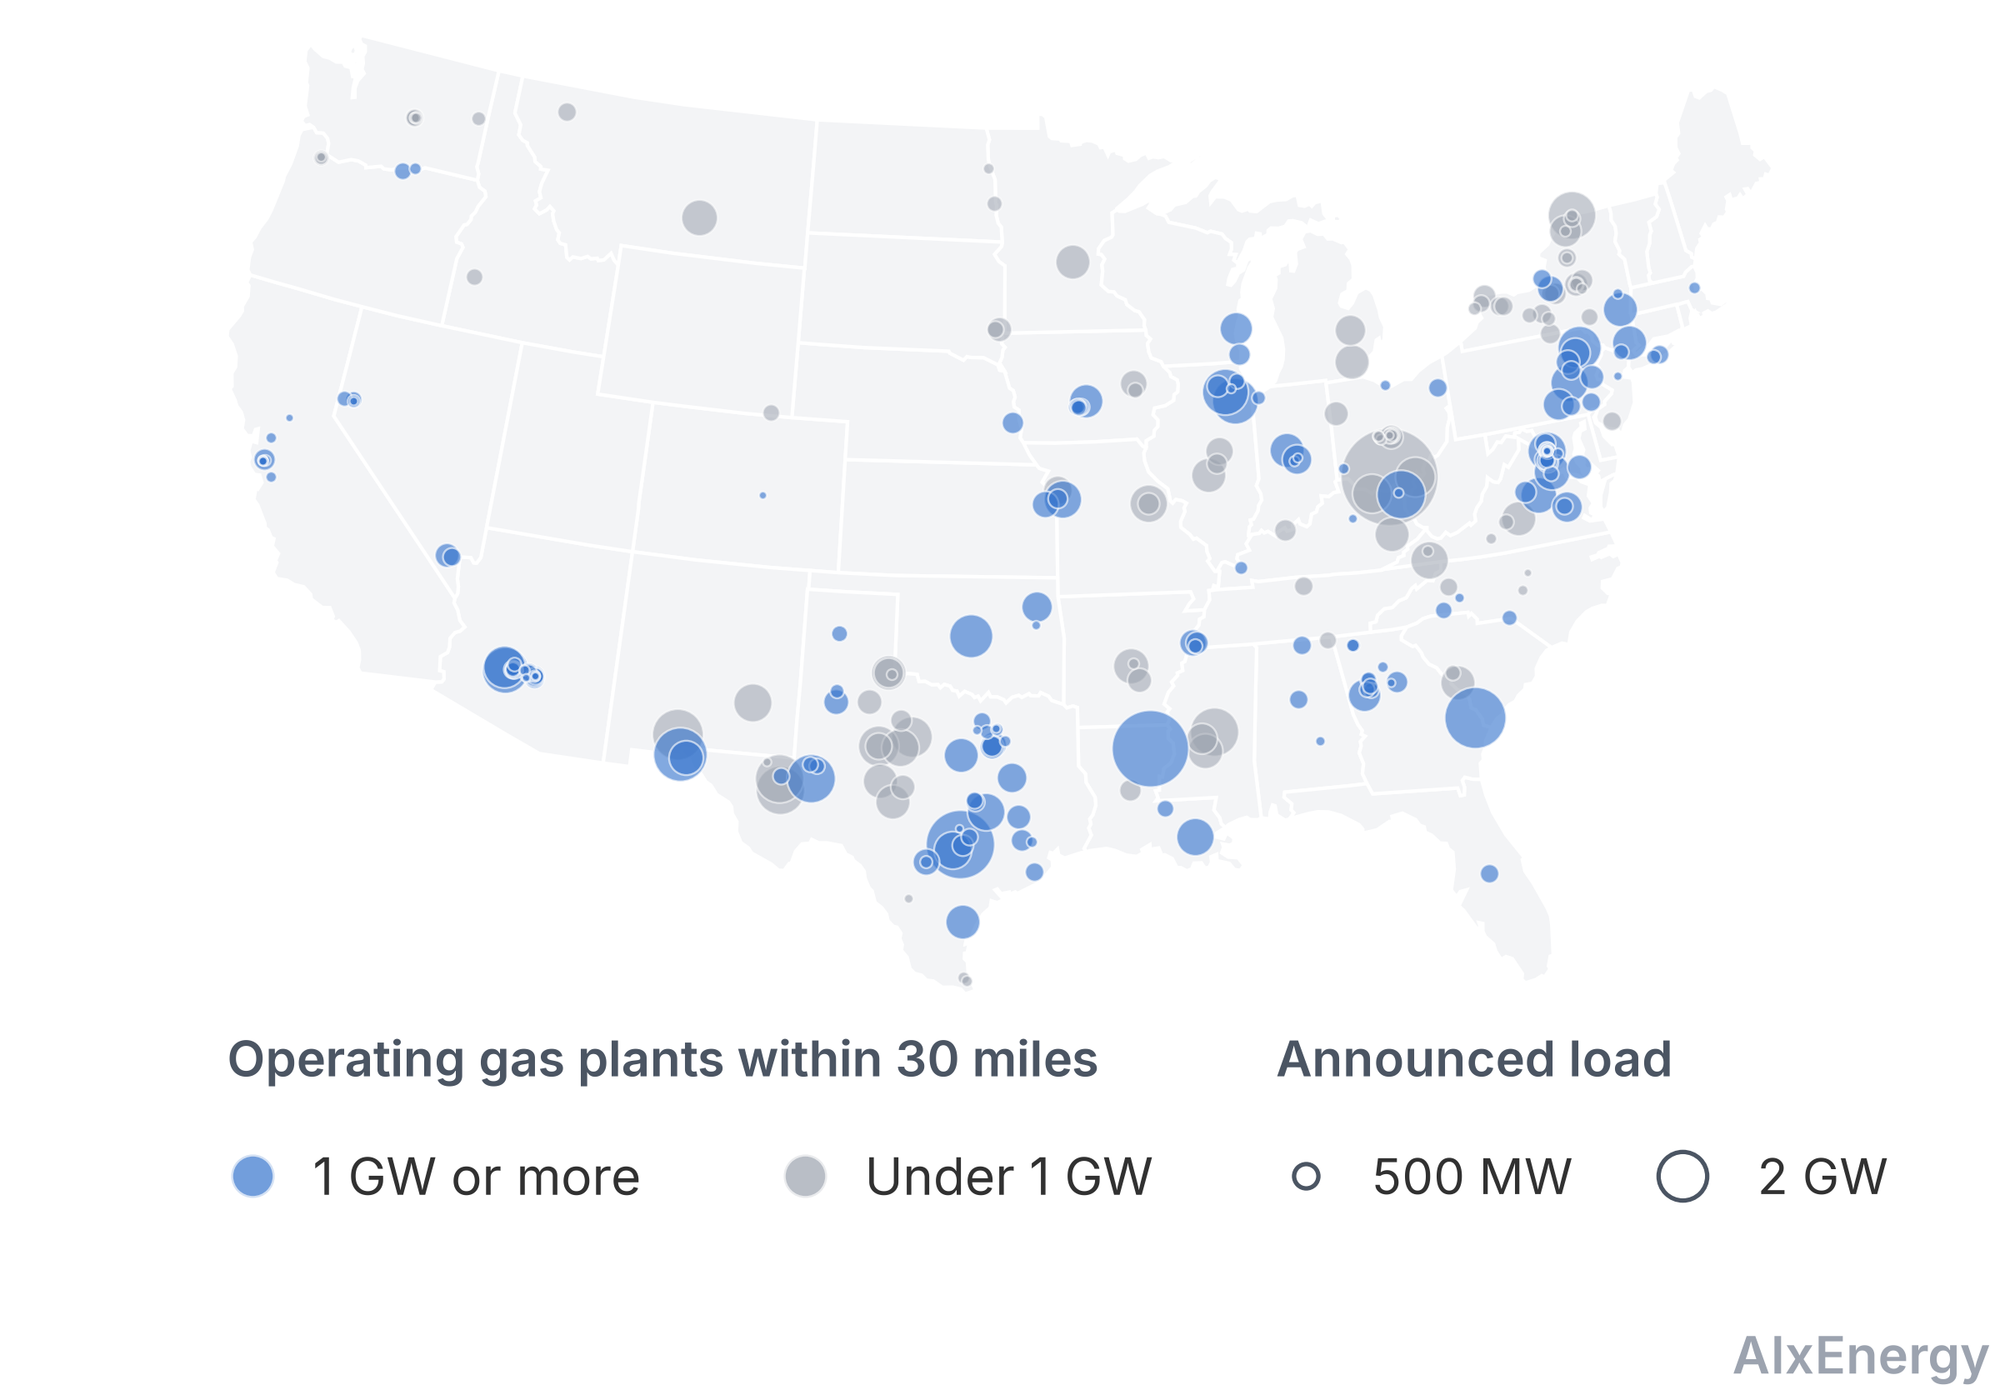
query_fuel_and_generation_assets tool; the layers behind it are combined in the DC-associated generation scene. Queried October 30, 2026. Chart: AIxEnergy.A short distance to a pipeline says little about whether gas can be delivered. Enverus, a vendor of energy market data, puts the question as four tests: gas has to be available, accessible, routable and durable.6 Pipeline capacity may exist on paper and be fully contracted. A lateral needs rights of way and permits, and Permian associated gas can move with oil economics rather than power demand. The Map's records show how far apart nearness and deliverability can sit. The Abilene campus near Abilene, Texas, listed at 1,200 MW and as energizing, is 4 kilometers from an Atmos pipeline, has 23 mapped pipelines within about 30 miles and carries a Map citygate price of $4.11 per MMBtu. The substation the Map designates for its interconnection is a 138 kV station rated at 90 MVA, far too small to serve that load, so it is best read as the nearest grid asset. The pricing node it assigns is 149 kilometers away and is labeled a regional approximation.2 The Childress campus is the reverse case. It is listed at 1,000 MW and as construction-ready, with a pipeline 1.1 kilometers away and no gas generation in the Map's local fuel mix within the radius, in a county that ERCOT ranks fifth in the state for base plus studied load at 6,750 MW.2, 7 For a developer, the screen that matters is a named delivery point with a contract behind it.
Existing generating sites hold two assets that a greenfield campus must still obtain, a generator interconnection and a combustion air permit. That is the case for converting peaker sites, with two limits. A permit written for peaking duty may cap annual hours or fuel use, so baseload operation could require a modification, and the Environmental Protection Agency's July 2026 clarification on islanded generators leaves new source review, performance standards and state permitting in place.8 The second limit is competition. ERCOT's Batch Zero data list 11 projects in its withdrawal-limited private use network category, which covers load served by its own generation, with 9,478 MW of load against 15,444 MW of generation, of which 12,824 MW is gas.7 That is about 1.6 MW of generation for each MW of load, by AIxEnergy's arithmetic. ERCOT gives no reason, and redundancy is the likeliest one. An owner of existing turbines will often be bidding against new capacity sized well above the load.
Grid and market: the value moves from scarcity hours to every hour
A unit that wins at 10 percent utilization is not automatically the right unit at 90 percent. A study in iScience by Vanatta and colleagues finds that simple-cycle turbines outcompete combined cycles below an annual capacity factor of roughly 12 to 17 percent at today's prices, and projects peaking capacity growing from about 280 GW now to between 460 and 770 GW by 2050.9 A data center load sits far above that band. EIA's tested heat rates for 2025 are 10,975 Btu per kWh for gas turbines, 8,853 for internal combustion engines and 7,535 for combined cycle.10 At the Abilene citygate price, they imply fuel costs of about $45, $36 and $31 per MWh. Those are AIxEnergy's calculations from full-load fleet averages, so a modern simple-cycle machine will do better and a part-loaded one worse. The Map's gas price should be used to rank regions and not to price a contract. It assigns $4.11 (a Texas citygate) to some ERCOT campuses and $6.22 (an Oklahoma citygate) to others, Childress among them.3
The merchant alternative is also strong right now. PJM's 2028/29 capacity auction cleared at the cap of $325 per MW-day, or about $118.6 per kW-year, and procured 138,318 MW of unforced capacity. It still finished 6,831 MW short of the reliability requirement, the second auction in a row in which the whole RTO fell short.11 On June 9 PJM began facilitating bilateral agreements between large loads and generation, often of ten years or more, through a request for proposals, and in July it said it planned a reliability backstop procurement.11 A load contract therefore has to beat capacity revenue in a short market, which is a firmer starting position for a peaker owner than when capacity was plentiful. The Map's interconnection queue scene places projects against the large-load queue.
Federal rules are changing the structures on offer. FERC's December 2025 order on PJM co-location directed three services for generation that serves co-located load: an interim network service that is nonfirm until the required upgrades are complete, and firm and nonfirm contract demand service. It also found PJM's behind-the-meter netting rules no longer just and reasonable. A June 18, 2026 order accepted PJM's compliance filing in part, set rates and terms for the new services after a paper hearing and called for further filings. The December order had directed a three-year transition and grandfathering for existing netting arrangements.12 On October 9 the Commission accepted PJM's definition of a large load and a registry effective October 12, and rejected PJM's curtailment framework, known as IRAS, and its bring-your-own-new-capacity rules.13 The practical consequence for a peaker owner is that the service category of a co-located load, as much as its physical connection, determines whether the plant's output counts as firm for that load.
ERCOT's situation is different and no simpler. After an August 3 directive from Governor Abbott for an audit, ERCOT paused study of Batch Zero and approvals to energize data centers and crypto facilities of 75 MW or more. Its September 3 conditional classification places 204 projects, at 66.4 GW, in base load and 158 projects, at 127.9 GW, in studied load, and excludes 373 projects totaling 302.2 GW. Eligibility verification and community impact reports are due December 10.7 Where grid service is slow, the alternatives are as much contract and permitting questions as engineering ones. Vinson & Elkins lists retail and sleeved supply in front of the meter, behind-the-meter generation, equipment leases with services agreements, bridge power from mobile packs of 5 to 25 MW that are often dual-fuel, and build-own-transfer arrangements.14 EPA's July 16 memo says the Acid Rain Program does not apply to a facility with no connection to the larger grid, and its one example is about 500 MW of simple-cycle turbines and engines serving an adjacent data center.8 A grid-connected peaker does not fit that example on its face. The memo is guidance rather than a rule adopted after notice and comment, which leaves it more exposed to challenge. A July 22 notice of intent to sue over two San Antonio campuses raises source aggregation, the question of whether separately permitted units should be treated as one source.8
Capital: availability contracts and the cost of being late
A peaker earns scarcity revenue, and a data center contract pays for availability, so the instrument itself changes. Vinson & Elkins describes monthly capacity payments per MW as common in behind-the-meter, bridge and tolling structures, with energy charges layered on top.14 Availability targets are tighter than in a front-of-meter PPA, where 95 to 98 percent annually is typical, against 99 percent or more monthly for behind-the-meter and bridge supply, with tiered liquidated damages and a capacity payment adjustment once a cap is reached.14 Minimum load commitments step up in tranches with shortfall settlement, force majeure typically does not excuse them, and a buyer that accelerates a tranche cannot later reduce it.14 Whether an older fleet can meet a monthly availability standard at 90 percent utilization is a maintenance question that a lender will put to the owner. For bridge supply, the same presentation lists equipment swap and rapid unit replacement rights for underperforming mobile units.14
Counterparty credit carries more weight than it does in a merchant business. On a 15 to 20 year contract worth hundreds of millions to billions of dollars, the presentation observes, the termination payment method can produce very different outcomes depending on market conditions at termination, and for behind-the-meter and bridge supply it may use the present value of all future payments.14 It also flags a credit cliff for newer data center entrants that are pre-IPO or recently public, because an IPO may itself trigger a change of control and rating-based thresholds may not apply to unrated companies.14 Delay is allocated on similar lines. Damages are typically stated per MW-day with aggregate caps. Excusable delay includes interconnection and network upgrade delays beyond the seller's control, sometimes capped at 365 days, and the market is moving from delay-triggered termination toward self-help, cure and step-in rights.14 An owner with no interconnection upgrade to wait for holds a stronger position under such a clause, which is one financial reading of the existing-site advantage.
Equipment is the other source of delay. GE Vernova's gas turbine backlog ended the second quarter of 2026 at 116 GW, up from 100 GW a quarter earlier, and the company expects 125 GW by year-end. It shipped 3 GW in the quarter, signed 20 GW of orders and slot reservations, and is taking reservations for 2031 delivery.15 About a fifth of its customers are data centers.15 A BNP Paribas analyst estimated turbine prices of about $790 per kW for heavy-duty machines, $950 for HA-class combined-cycle turbines and $1,800 for aeroderivatives, as reported by Utility Dive.15 Against PJM's cap revenue of $118.6 per kW-year, the turbine alone equals about 15 years of that revenue for an aeroderivative and about 6.7 years for a heavy-duty unit. The comparison is deliberately crude. It sets gross revenue against turbine price and leaves out balance of plant, fuel, operations and interconnection. Its use is to show why installed fast-start capacity at a connected site can be worth more than its merchant earnings suggest when a new machine means a 2031 delivery.
The Map's underwriting records show the same dependence on equipment. Every record carries a 148-week lead time for a large step-up transformer against a 104-week baseline, and the figure is identical on all nine campuses I queried, so it is a market-level input and says nothing specific about Abilene.2 The Map organizes a large-load record by source, with physical siting from the Map, queue status from Monitor and capital stack and delay risk from Capital.2 Several fields in those nine records looked templated. All nine carry the same firm-service label, two share an identical modeled curtailment risk of 85 percent, and six queue records are flagged as synthetic mirrors of the campus. Fields like these are prompts for diligence and carry no evidential weight, and the use of an integrated record is that it shows which siting, queue and capital inputs are confirmed and which were matched only by proximity.
Notes
- U.S. Energy Information Administration, “Electric Power Monthly,” Table 6.07.A, Capacity Factors for Utility Scale Generators Primarily Using Fossil Fuels, https://www.eia.gov/electricity/monthly/epm_table_grapher.php?t=epmt_6_07_a. Gas turbine 13.6 percent and combined cycle 58.7 percent for 2025; gas turbine 23.6 percent for July 2026 and 23.4 percent for August 2026, both preliminary. ↩
- AIxEnergy, “AIxEnergy Map,” project records for stargate-abilene and crusoe-lancium-childress-ai-campus, plus large-load underwriting output for nine projects, October 30, 2026. The 95.7 percent load factor (97.0 percent on some other campuses) is a modeled shape and not a metered value, and the 148-week transformer lead time is a Map heuristic that applies to a 500 kV or 765 kV step-up transformer. ↩
- AIxEnergy, “AIxEnergy Map,” https://map.aixenergy.io/, fuel and generation scan through the
query_fuel_and_generation_assetstool, run October 30, 2026 on the full project set (the public view shows a preview of 50 of 2,728 projects). The Map lists 304 U.S. projects of 50 MW or more; 17 lack coordinates, so 287 were scanned, and 283 of those have a mapped high-pressure pipeline within 30 miles. All distance and generation statistics describe those 283. Coordinates are approximate for 245 of the 283, so distances are screening-grade. The scenes for site screening, behind-the-meter supply mix, capacity markets, nodal prices, natural gas prices, utility service conditions, equipment reuse and supply chain stress are available to Map users and do not populate in the public preview. The Map applies the $6.22 Oklahoma citygate price to 15 of its 50 ERCOT campuses in the scan and the $4.11 Texas citygate price to 15 others. ↩ - AIxEnergy, “The Factory Queue Is the New Interconnection Queue: Who Gets the Transformer Slots,” October 30, 2026, https://www.aixenergy.io/the-factory-queue-is-the-new-interconnection-queue/. ↩
- AIxEnergy, “How Data Center Deals Allocate Delay Risk,” October 25, 2026, https://www.aixenergy.io/carrying-the-bill-how-data-center-deals-allocate-infrastructure-delay-risk/. ↩
- Enverus, “Can the Gas Actually Reach Your BYOG Data Center Site?,” October 22, 2026, https://www.enverus.com/blog/can-gas-actually-reach-byog-data-center-site/. A vendor publication. ↩
- Electric Reliability Council of Texas, “Batch Zero Update,” board materials, September 14 to 15, 2026, https://www.ercot.com/files/docs/2026/09/11/14-Batch-Zero-Update.pdf. The generation to load ratio is AIxEnergy’s division of ERCOT’s totals. The deck’s headline gives 127.9 GW for studied load, while one chart in the same deck shows 125.4 GW; the headline figure is used here. ↩
- WilmerHale, “Islanded but Not Unregulated or Unchallenged: New Developments for Behind-the-Meter Data Center Power Generation,” client alert, August 12, 2026, https://www.wilmerhale.com/en/insights/client-alerts/20260812-islanded-but-not-unregulated-or-unchallenged-new-developments-for-behind-the-meter-data-center-power-generation, describing the Environmental Protection Agency’s July 16, 2026 clarification on islanded generators and the Acid Rain Program, and a July 22, 2026 notice of intent to sue. ↩
- Max Vanatta, Brian Sergi, Wesley Cole, Paul Denholm, and Trieu Mai, “The Past, Present, and Future of Peaking Thermal Power Plants in the United States,” iScience 29, no. 3 (2026), https://doi.org/10.1016/j.isci.2026.114886. Cited from the abstract as indexed at https://www.osti.gov/biblio/3022359. ↩
- U.S. Energy Information Administration, “Electric Power Annual,” Table 8.2, Average Tested Heat Rates by Prime Mover and Energy Source, https://www.eia.gov/electricity/annual/html/epa_08_02.html. Fuel cost per MWh is AIxEnergy’s multiplication of the 2025 heat rate by $4.11 per MMBtu. ↩
- PJM Interconnection, “PJM Capacity Auction Procures 138,318 MW of Generation Resources,” press release, July 14, 2026, https://www.pjm.com/-/media/DotCom/about-pjm/newsroom/2026-releases/20260714-pjm-capacity-auction-procures-138318-mw-of-generation-resources.pdf. The $118.6 per kW-year equivalent is AIxEnergy’s conversion of $325 per MW-day. ↩
- Federal Energy Regulatory Commission, order on compliance and paper hearing in Docket No. EL25-49-002, June 18, 2026, which summarizes the December 18, 2025 order in the same proceeding, https://www.ferc.gov/sites/default/files/2026-06/EL25-49-002_0.pdf. ↩
- Federal Energy Regulatory Commission, order in Docket No. ER26-3515-000, October 9, 2026, as posted by PJM, https://www.pjm.com/pjmfiles/directory/etariff/FercOrders/9207/20261009-er26-3515-000.pdf. ↩
- Vinson & Elkins LLP, “Power: Structuring a Data Center,” presentation dated September 1, 2026, https://www.velaw.com/wp-content/uploads/2026/06/Presentation-Power-Series-Structuring-a-Data-Center.pdf. Terms described are the firm’s summary of common market practice. ↩
- Brian Martucci, “GE Vernova Gas Turbine Backlog Climbs to 116 GW,” Utility Dive, July 23, 2026, https://www.utilitydive.com/news/ge-vernova-gas-turbine-backlog-climbs-to-116-gw/826039/. The per-kW prices are an analyst estimate reported there and cover turbines only. The payback comparison is AIxEnergy’s arithmetic. ↩
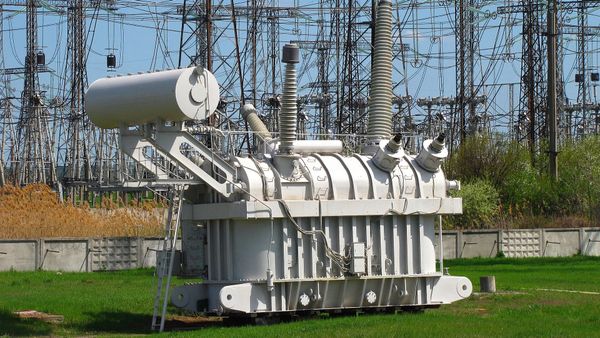
- FunksBrother, “Big Sandy Peaker Plant,” photograph, August 20, 2020, Wikimedia Commons, CC BY-SA 4.0, https://commons.wikimedia.org/wiki/File:Big_Sandy_Peaker_Plant.jpg. ↩
Bibliography
- AIxEnergy. “AIxEnergy Map: Project Records and Large-Load Underwriting Output.” https://map.aixenergy.io/. Accessed October 30, 2026.
- AIxEnergy. “AIxEnergy Map.” https://map.aixenergy.io/. Accessed October 30, 2026.
- AIxEnergy. “How Data Center Deals Allocate Delay Risk.” October 25, 2026. https://www.aixenergy.io/carrying-the-bill-how-data-center-deals-allocate-infrastructure-delay-risk/.
- AIxEnergy. “The Factory Queue Is the New Interconnection Queue: Who Gets the Transformer Slots.” October 30, 2026. https://www.aixenergy.io/the-factory-queue-is-the-new-interconnection-queue/.
- Electric Reliability Council of Texas. “Batch Zero Update.” Board materials, September 14 to 15, 2026. https://www.ercot.com/files/docs/2026/09/11/14-Batch-Zero-Update.pdf.
- Enverus. “Can the Gas Actually Reach Your BYOG Data Center Site?” October 22, 2026. https://www.enverus.com/blog/can-gas-actually-reach-byog-data-center-site/.
- Federal Energy Regulatory Commission. Order, Docket No. EL25-49-002. June 18, 2026. https://www.ferc.gov/sites/default/files/2026-06/EL25-49-002_0.pdf.
- Federal Energy Regulatory Commission. Order, Docket No. ER26-3515-000. October 9, 2026. https://www.pjm.com/pjmfiles/directory/etariff/FercOrders/9207/20261009-er26-3515-000.pdf.
- FunksBrother. “Big Sandy Peaker Plant.” Photograph, August 20, 2020. Wikimedia Commons, CC BY-SA 4.0. https://commons.wikimedia.org/wiki/File:Big_Sandy_Peaker_Plant.jpg.
- Martucci, Brian. “GE Vernova Gas Turbine Backlog Climbs to 116 GW.” Utility Dive, July 23, 2026. https://www.utilitydive.com/news/ge-vernova-gas-turbine-backlog-climbs-to-116-gw/826039/.
- PJM Interconnection. “PJM Capacity Auction Procures 138,318 MW of Generation Resources.” Press release, July 14, 2026. https://www.pjm.com/-/media/DotCom/about-pjm/newsroom/2026-releases/20260714-pjm-capacity-auction-procures-138318-mw-of-generation-resources.pdf.
- U.S. Energy Information Administration. “Electric Power Monthly.” Table 6.07.A, Capacity Factors for Utility Scale Generators Primarily Using Fossil Fuels. https://www.eia.gov/electricity/monthly/epm_table_grapher.php?t=epmt_6_07_a.
- U.S. Energy Information Administration. “Electric Power Annual.” Table 8.2, Average Tested Heat Rates by Prime Mover and Energy Source. https://www.eia.gov/electricity/annual/html/epa_08_02.html.
- Vanatta, Max, Brian Sergi, Wesley Cole, Paul Denholm, and Trieu Mai. “The Past, Present, and Future of Peaking Thermal Power Plants in the United States.” iScience 29, no. 3 (2026). https://doi.org/10.1016/j.isci.2026.114886.
- Vinson & Elkins LLP. “Power: Structuring a Data Center.” Presentation, September 1, 2026. https://www.velaw.com/wp-content/uploads/2026/06/Presentation-Power-Series-Structuring-a-Data-Center.pdf.
- WilmerHale. “Islanded but Not Unregulated or Unchallenged: New Developments for Behind-the-Meter Data Center Power Generation.” Client alert, August 12, 2026. https://www.wilmerhale.com/en/insights/client-alerts/20260812-islanded-but-not-unregulated-or-unchallenged-new-developments-for-behind-the-meter-data-center-power-generation.