AIxEnergy Map brings the documented AI infrastructure pipeline, proprietary screening, electricity demand, grid infrastructure, interconnection activity, markets, water and policy into one professional decision environment — so teams can move from a question to a defensible screen.
The decision problem
The answer does not live in one dataset.
Public GIS can show a transmission line. A market terminal can show a price. Neither can tell you which documented AI campuses sit on that corridor, how complete the underlying evidence is, or how first energization screens under competing risks.
AIxEnergy Map connects the project pipeline to power infrastructure, demand, interconnection activity, markets, water, policy and proprietary analytics so those relationships can be examined together.
You are not buying 83 layers. You are buying six capabilities.
Six capabilities
From market question to defensible screen.
Each capability begins with a decision professionals already need to make. The layers, models and evidence sit underneath that decision rather than becoming the product story themselves.
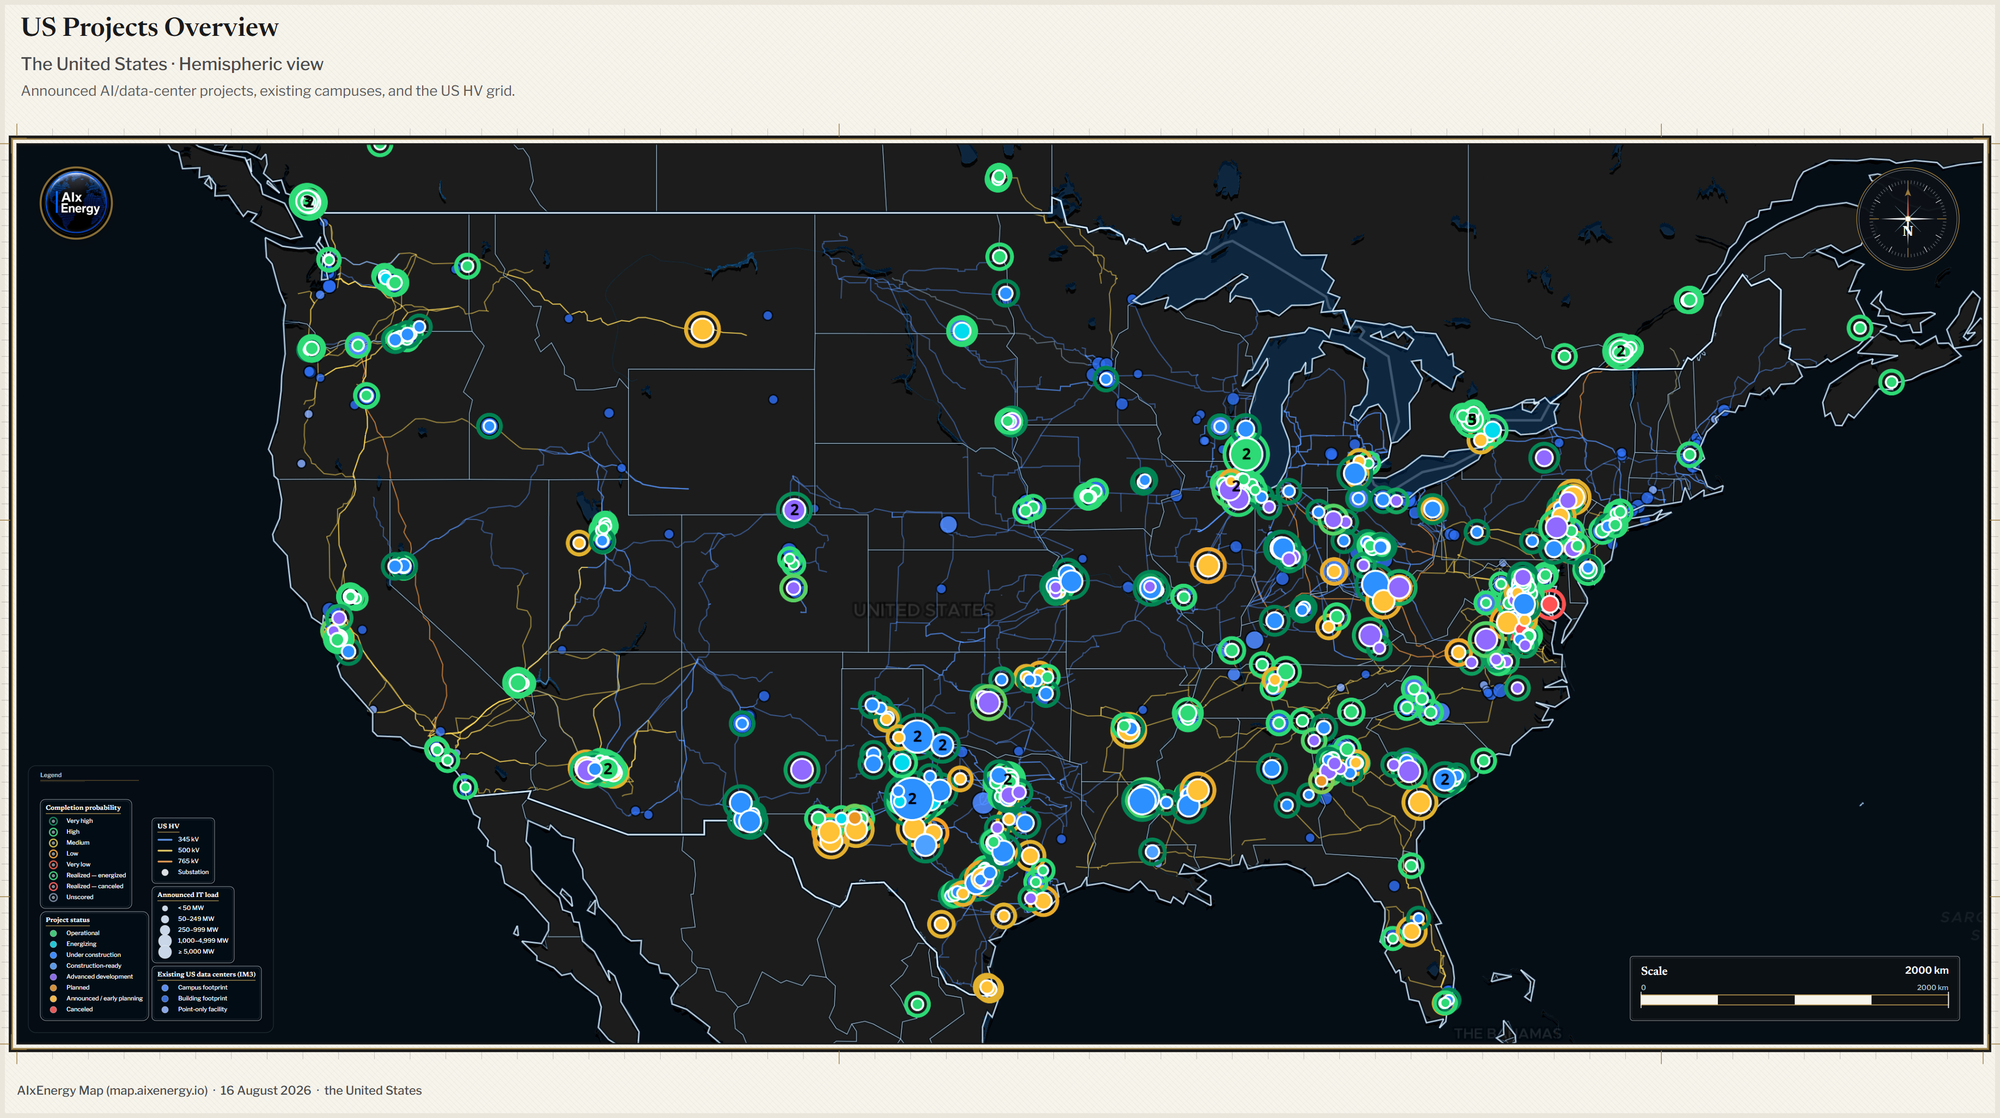
See the documented pipeline.
What is actually being proposed — and how far has it progressed?
AIxEnergy Map publishes a curated atlas of documented AI and large-load infrastructure. Marker fill represents normalized public project status. Marker border represents Project Completion Probability (PCP-1.1.0) — AIxEnergy's competing-risks screen of first energization versus cancellation versus remaining in the pipeline.
Click a campus to open Project Intelligence: evidence, power, environmental, site and market context, together with ranked findings that can be returned directly to the map. Existing U.S. facilities from the PNNL IM3 atlas sit beside the development pipeline so operating stock is not confused with what has merely been proposed.
Underwrite an announced campus. See who is already developing nearby. Rank a state before ranking individual cells. Share a project profile as a reusable evidence reference.
Primary usersInfrastructure investors, private equity, banks, hyperscalers, developers, utility large-load teams, economic-development organizations and consultants.
Screen a campus before you fly.
The expensive studies should start after the cheap ones are finished.
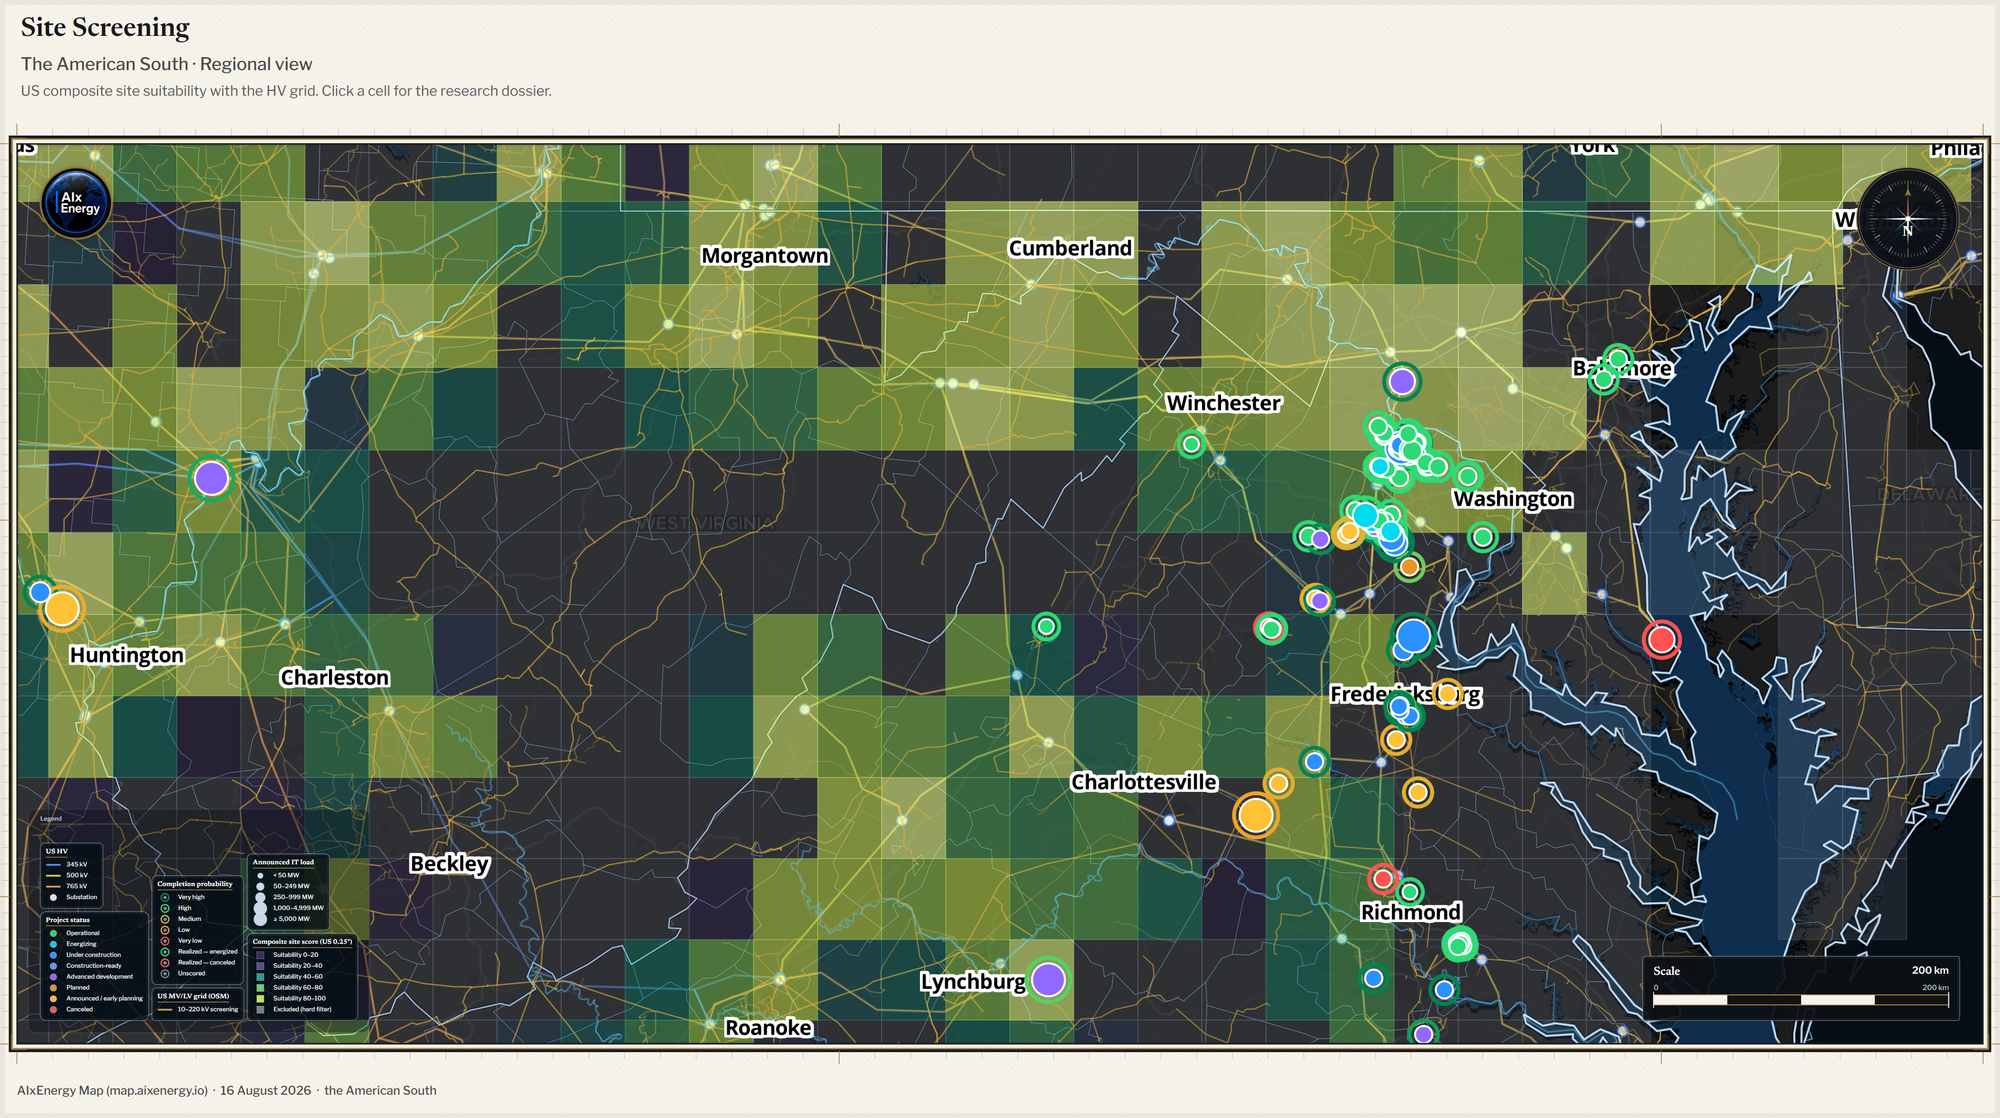
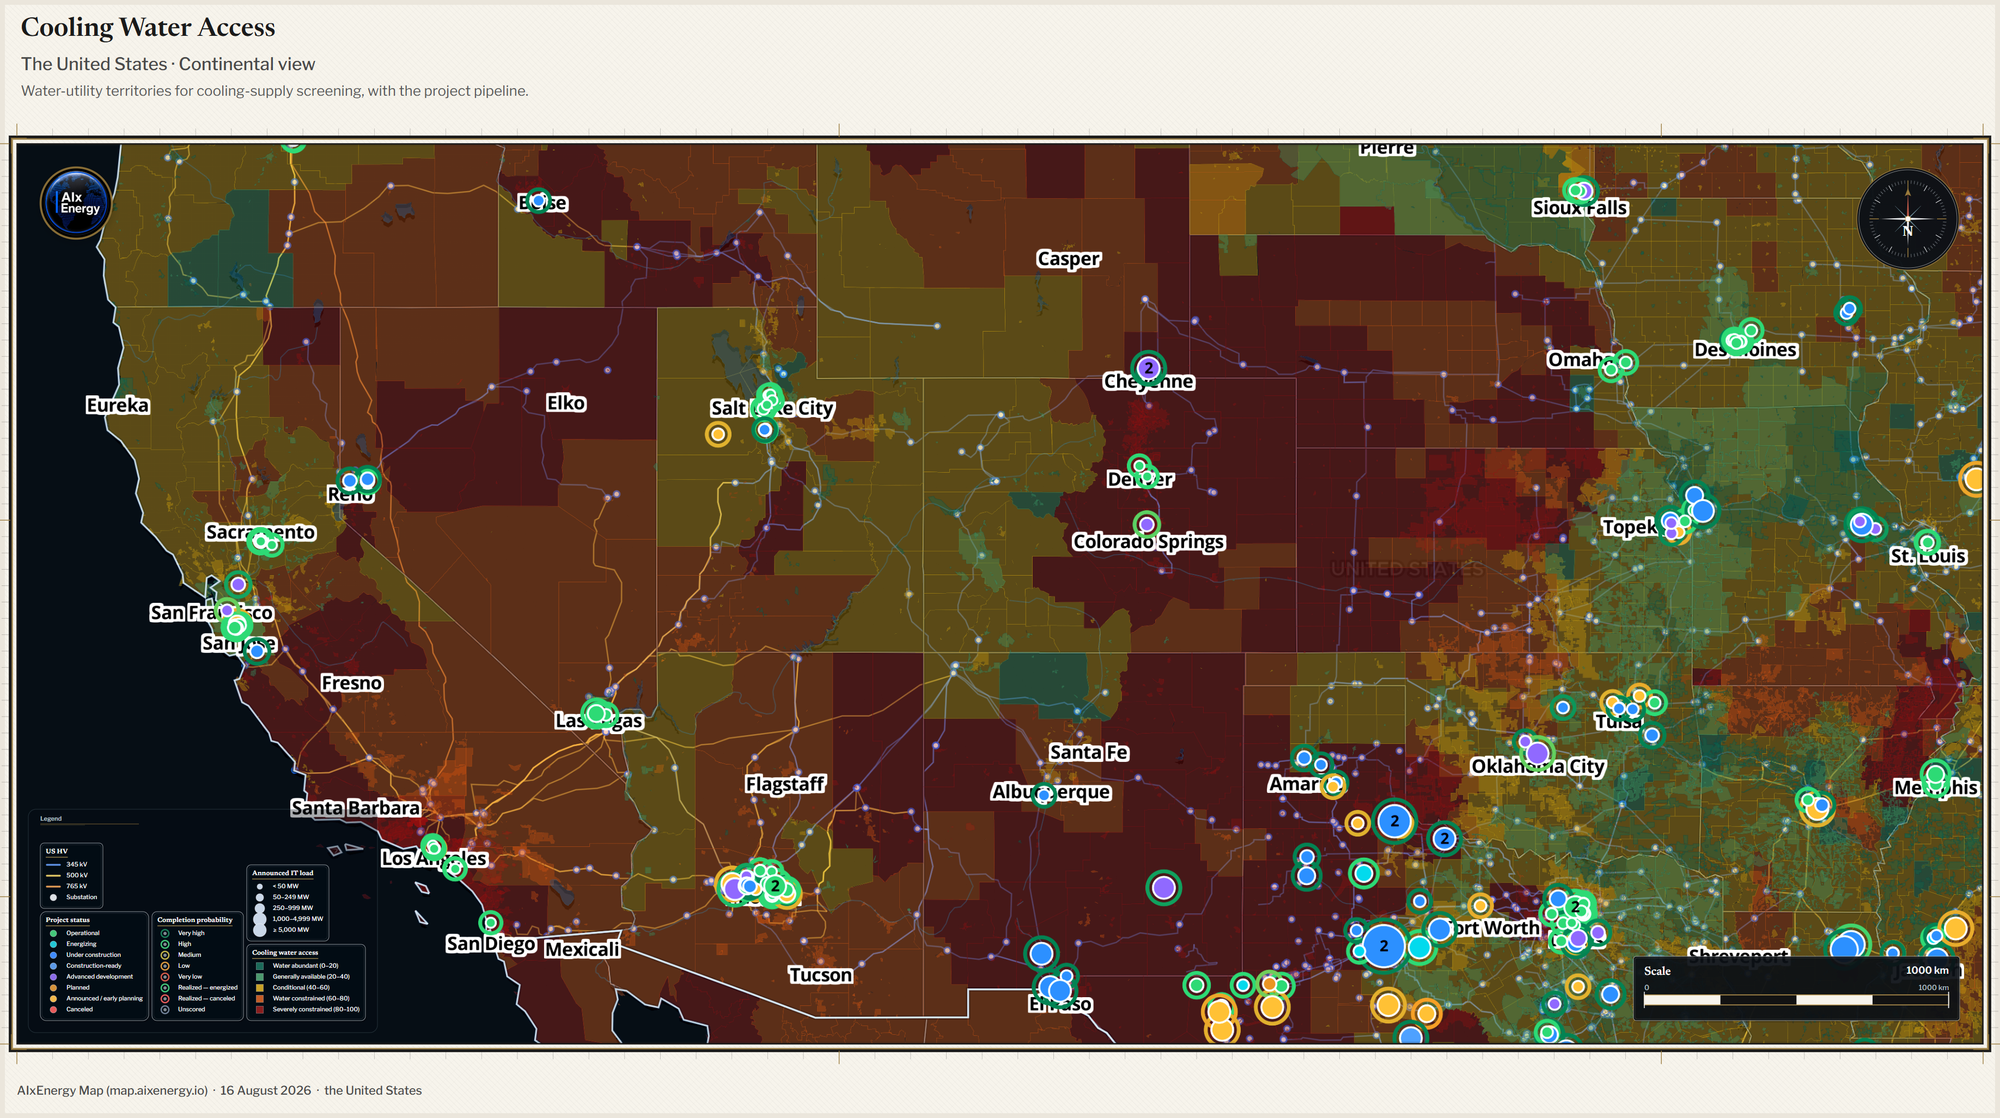
Composite Site Score (CSS-4.0.0) combines power access, cooling climate, fiber, cooling-water access, C&I electricity price, natural hazard and permitting friction on a 0.25° U.S. grid.
Hard exclusions screen out cells with no nearby high-voltage substation, steep slope or wetland cover. Click a cell for its research dossier. Drop a pin for a live siting pre-read. Then stack cooling-water territory friction, permitting, large-load tariff applicability, flood and wetlands before committing expensive field diligence.
Europe uses the same core screening recipe on a 0.25° densified grid, with queue congestion and U.S.-specific terrain filters omitted.
Build a 200–400 MW greenfield shortlist. Eliminate water-infeasible locations. Test the institutional stack. Compare European markets using a consistent screening language.
Primary usersHyperscaler site-selection teams, data-center developers, consultants, engineering firms, industrial large-load customers and economic-development organizations.
Read two queues and the stressed grid.
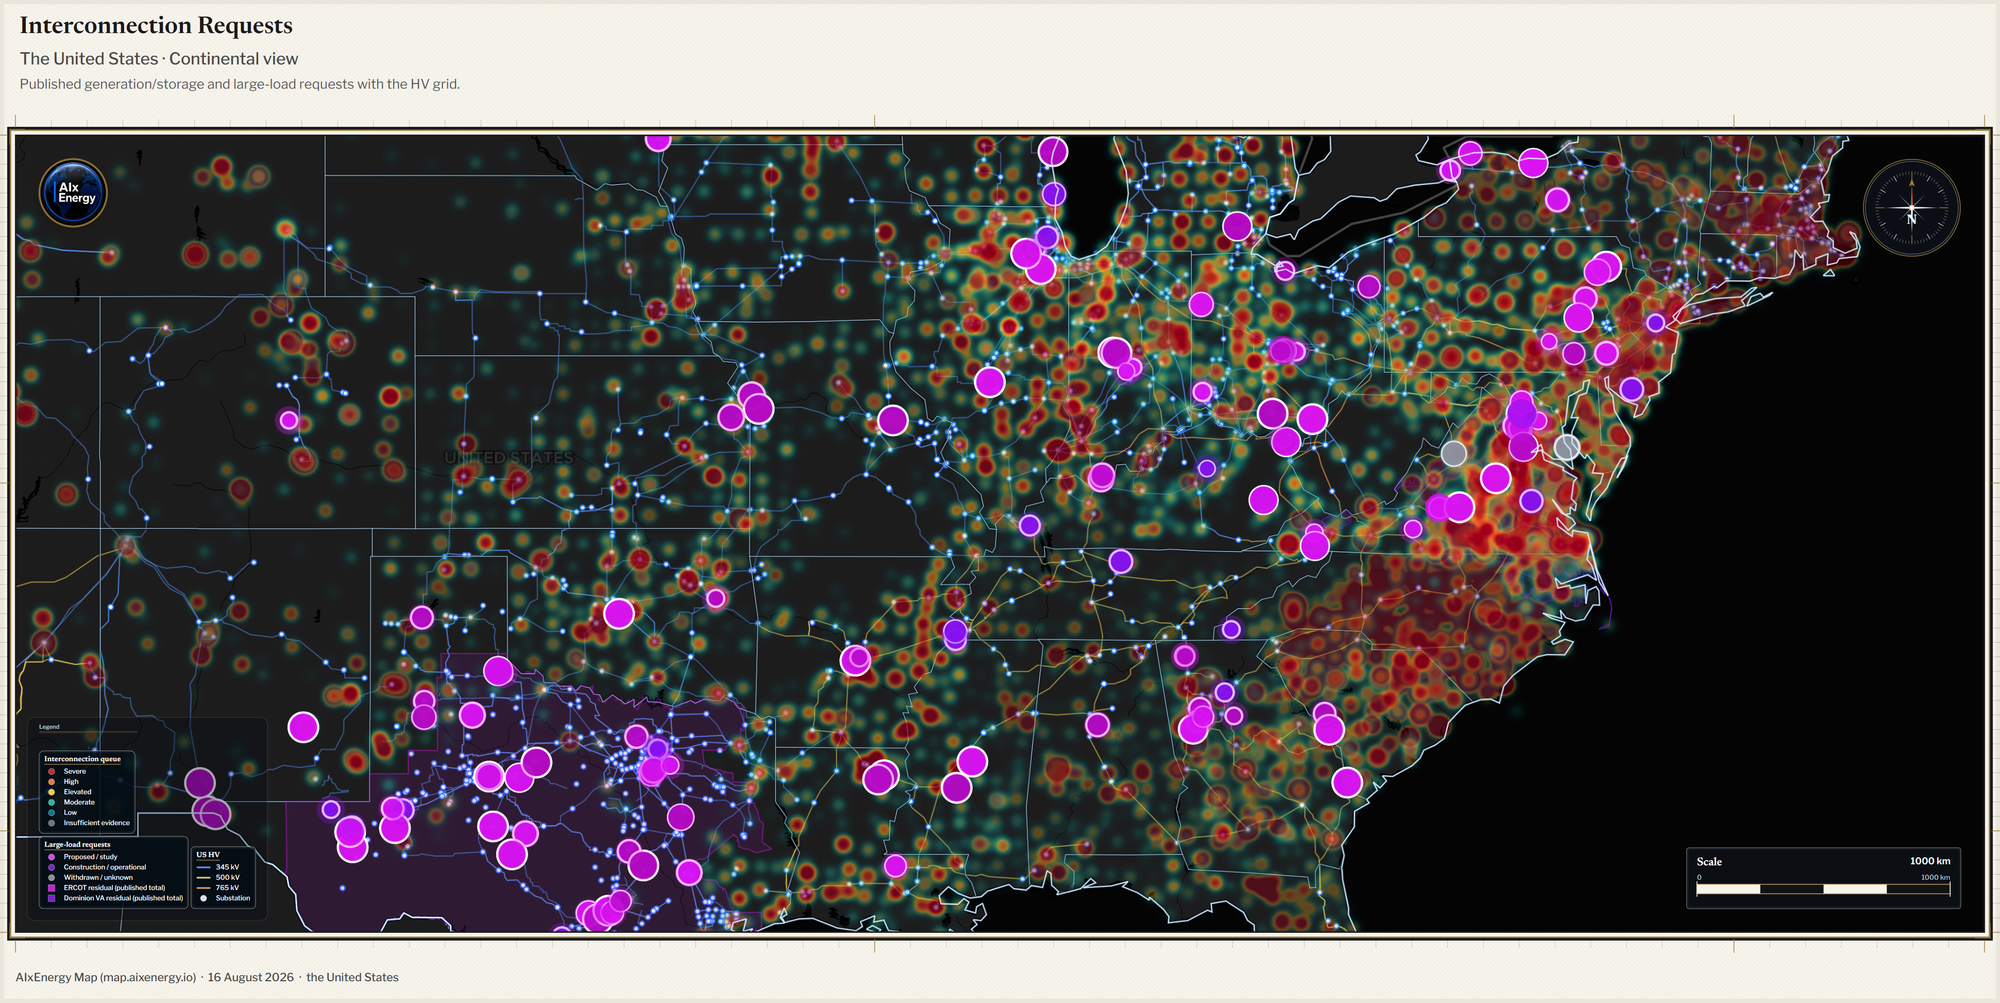
There are two queues on this map. They are not the same object. Cheap is not available capacity.
Generation and storage interconnection requests render as a teal-to-crimson stress heatmap. Large-load requests render separately in magenta through AIxEnergy's classified national screen (LLQ-1.3.0), combining BPA named queue GIS, announced campuses of at least 50 MW, named public filings, and ERCOT and Dominion residual totals.
Residual totals remain territory polygons. Points are not invented from aggregate data. Alongside them sit HIFLD extra-high-voltage transmission, ISO day-ahead binding constraints matched to substations, nodal day-ahead LMP at matched HIFLD nodes, and public under-construction transmission corridors.
Compare competing generation and competing load. Read price next to documented congestion. Time a transmission corridor. Screen likely energization against published queue pressure.
Primary usersUtility and transmission-owner large-load teams, hyperscalers, generation developers, transmission developers, storage developers and investors.
See demand shock before the planning cycle.
Expected 2030 load is probability-weighted. The unadjusted announcement book is not the forecast.
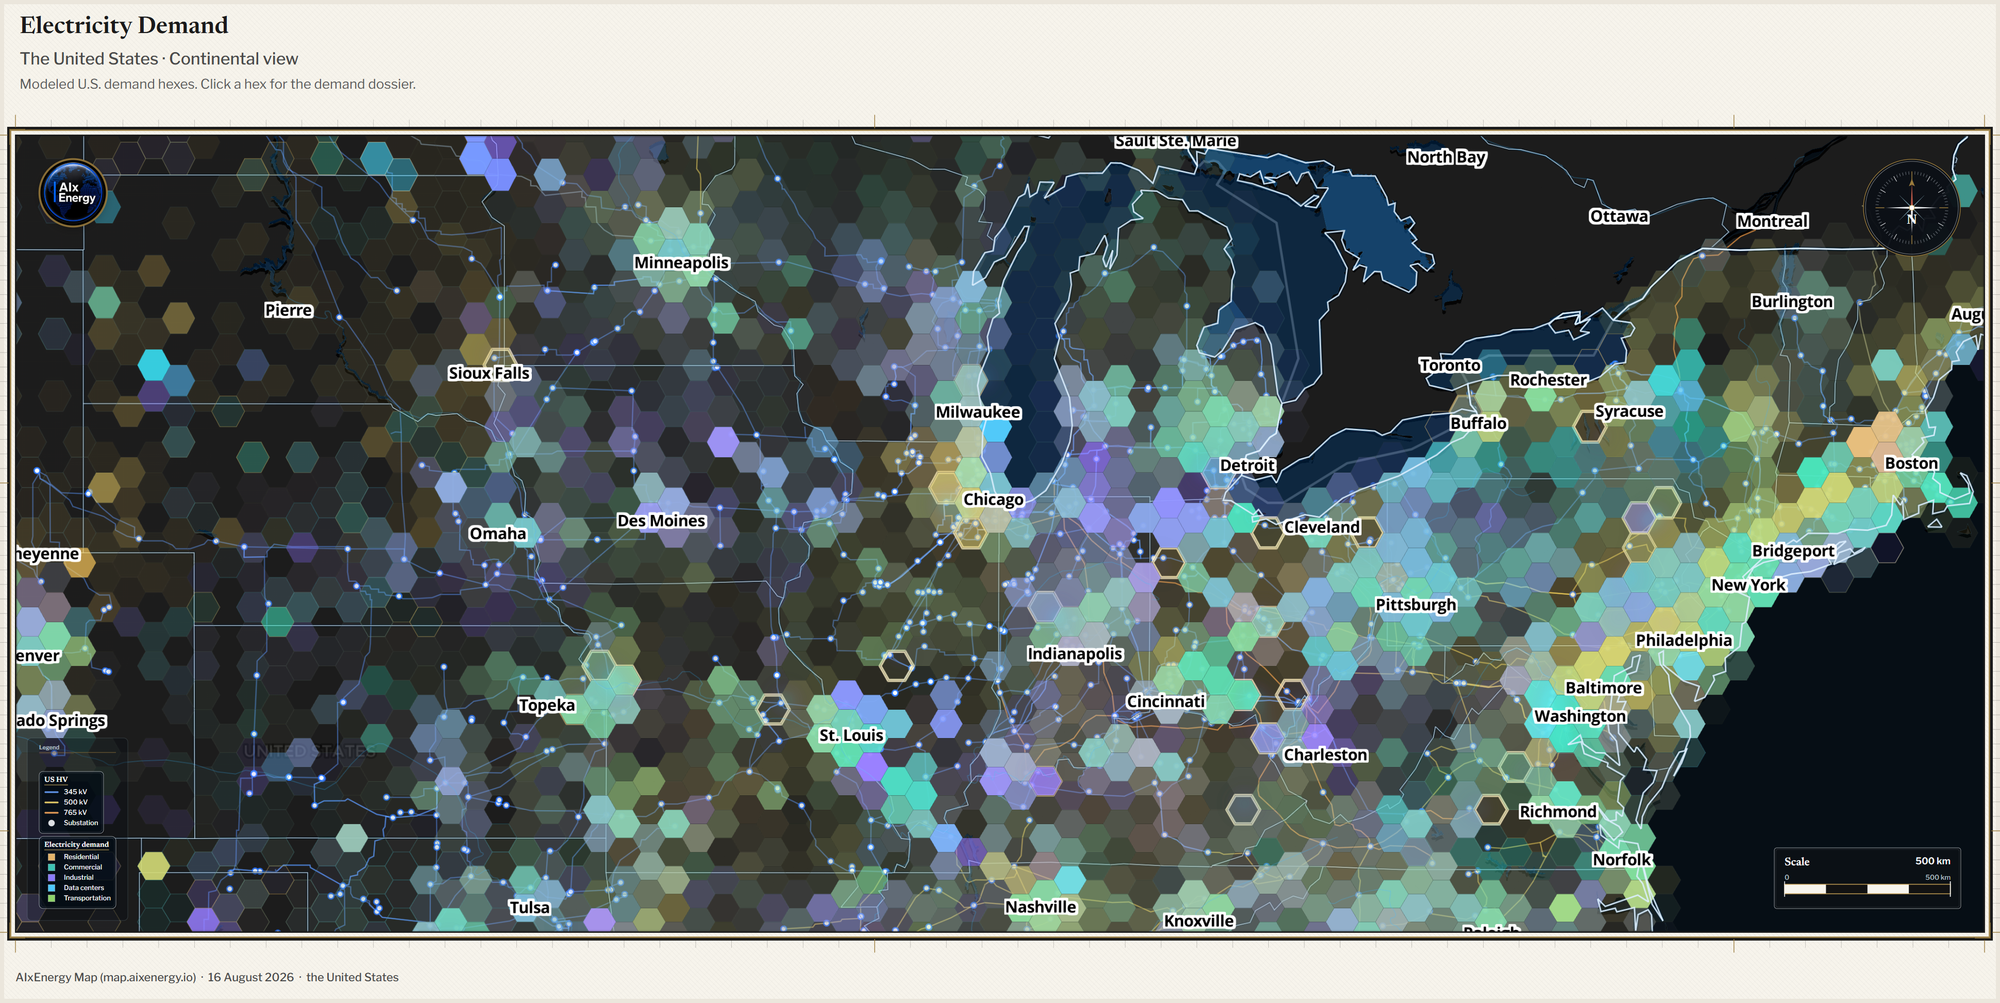
Electricity Demand (EDM-1.4.0) is a bottom-up U.S. demand model calibrated to EIA-861. Hexes show who consumes electricity, how organic demand is changing and, in 2030, where expected first-energization load would stack on existing local peak.
Operational campuses use recorded operating or energized IT MW when that evidence exists. Announced IT capacity is never presented as operating load, and proposed load never enters the 2024 baseline.
Click a demand hex and the map identifies nearby named atlas projects within roughly 50 km, allowing a high proposed-load share to be examined against actual project names, evidence grades and statuses rather than an anonymous demand smear.
Brief a large-load process before the next planning cycle. Separate organic growth from AI shock. Test a utility territory under incremental load. Show a board how proposed campuses compare with existing peak.
Primary usersUtility and transmission planners, regulators, public planners, infrastructure investors, consultants and economic-development organizations.
Price the power and the BTM alternative.
Cheap solar is not cheap 24/7 power. High AI load factor changes the comparison.
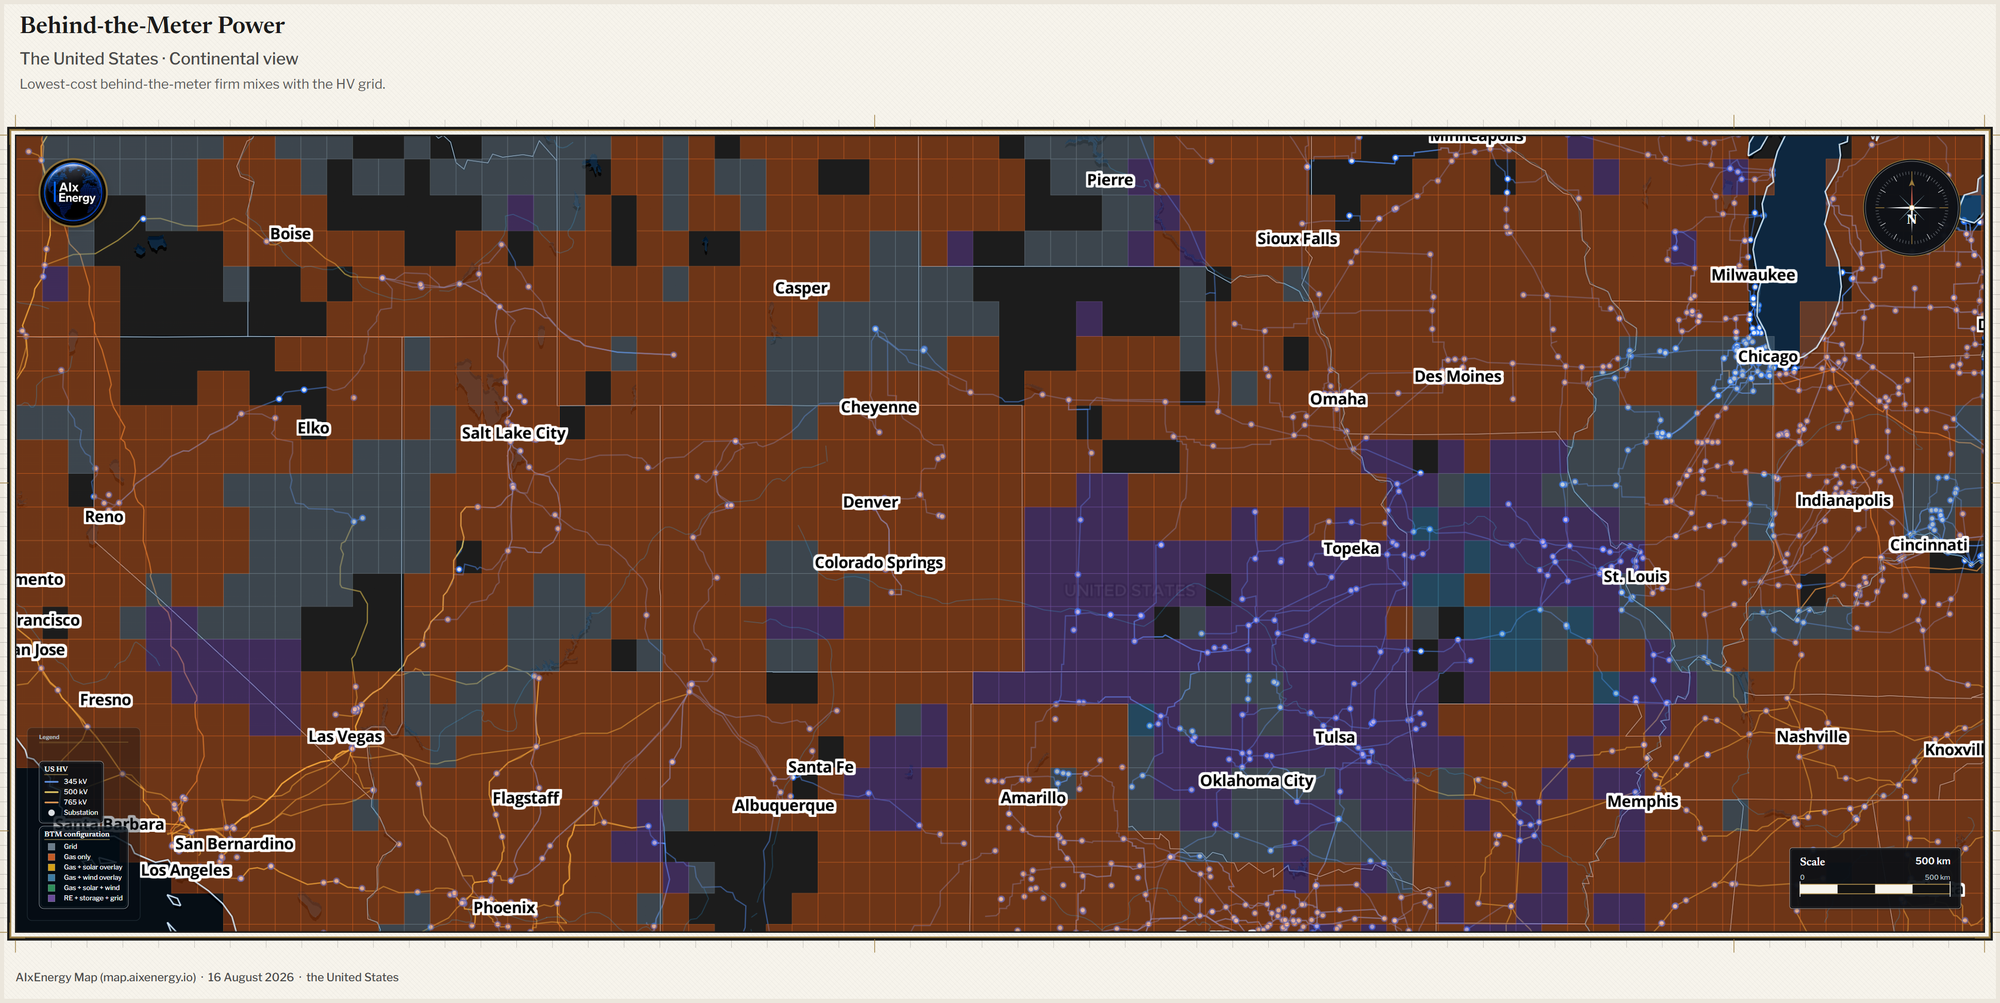
C&I retail prices, ISO zone and hub day-ahead prices, nodal LMP, gas delivery prices (GDPI) and coal delivery prices (CDPI) share the same decision environment.
Behind-the-Meter Configuration identifies the lowest screened firm $/MWh configuration for a flat 24/7 AI load among four alternatives: grid, gas, gas plus renewables, or renewables plus storage plus grid.
BTM Gas Favorability answers a narrower question: where does pipeline-gated gas screen cheaper than industrial retail electricity on a typical day? The analysis can then be viewed beside gas pipelines, gas delivery prices and large-load tariff constructs.
Test BTM optionality. Compare retail, zone and nodal power economics. Evaluate gas and coal on a common fuel-cost basis. Understand where a large-load tariff construct appears to apply.
Primary usersIndustrial and campus energy teams, developers considering on-site firm power, IPP and hybrid developers, investors, utility rate teams and utility large-load teams.
Leave with a packet, not a screenshot.
A View replaces layers on purpose. Repeatability is the product. A 40-layer map is not.
Sixteen curated Views apply the layer pack, camera and basemap required for one decision. Analysis screens the project atlas against registered conditions and reports pass, fail or unknown, together with the dominant eliminating criterion — including missing data.
Charts quantify what is actually on the map. Pin-drop analysis, CSS cell dossiers and, in supported U.S. cells, parcel research turn a coordinate into a structured pre-read. Executive PDFs and an untitled map plate turn the interactive analysis into material that can leave the application.
My Views stores zoom, basemap and layer configuration to the signed-in account, while share URLs can recover the camera, project or scene.
Run a registered multi-layer question. Hand the match set to Charts. Save the scene. Export the Analysis PDF. Deliver a state or regional decision packet that another professional can reopen.
Primary usersConsultants, engineering firms, utility planning and large-load teams, investment committees, developer steering committees, economic-development organizations and regulators.
Sample outputs
See what leaves the map.
AIxEnergy Map is designed to produce more than an interactive screen. Project diligence, site screening and multi-layer analysis can move directly into professional decision processes through structured executive reports.
The examples below show how map-based intelligence is converted into reusable professional outputs for project diligence, site evaluation and executive analysis.
Who uses AIxEnergy Map
Different organizations. The same physical system.
Eight buyer groups sit on the same map. They do not need eight products. They need the six capabilities in different sequences.