AIxEnergy Map brings together proprietary intelligence, public infrastructure data, market information, environmental constraints, and decision-oriented analytical layers in a single geospatial platform.
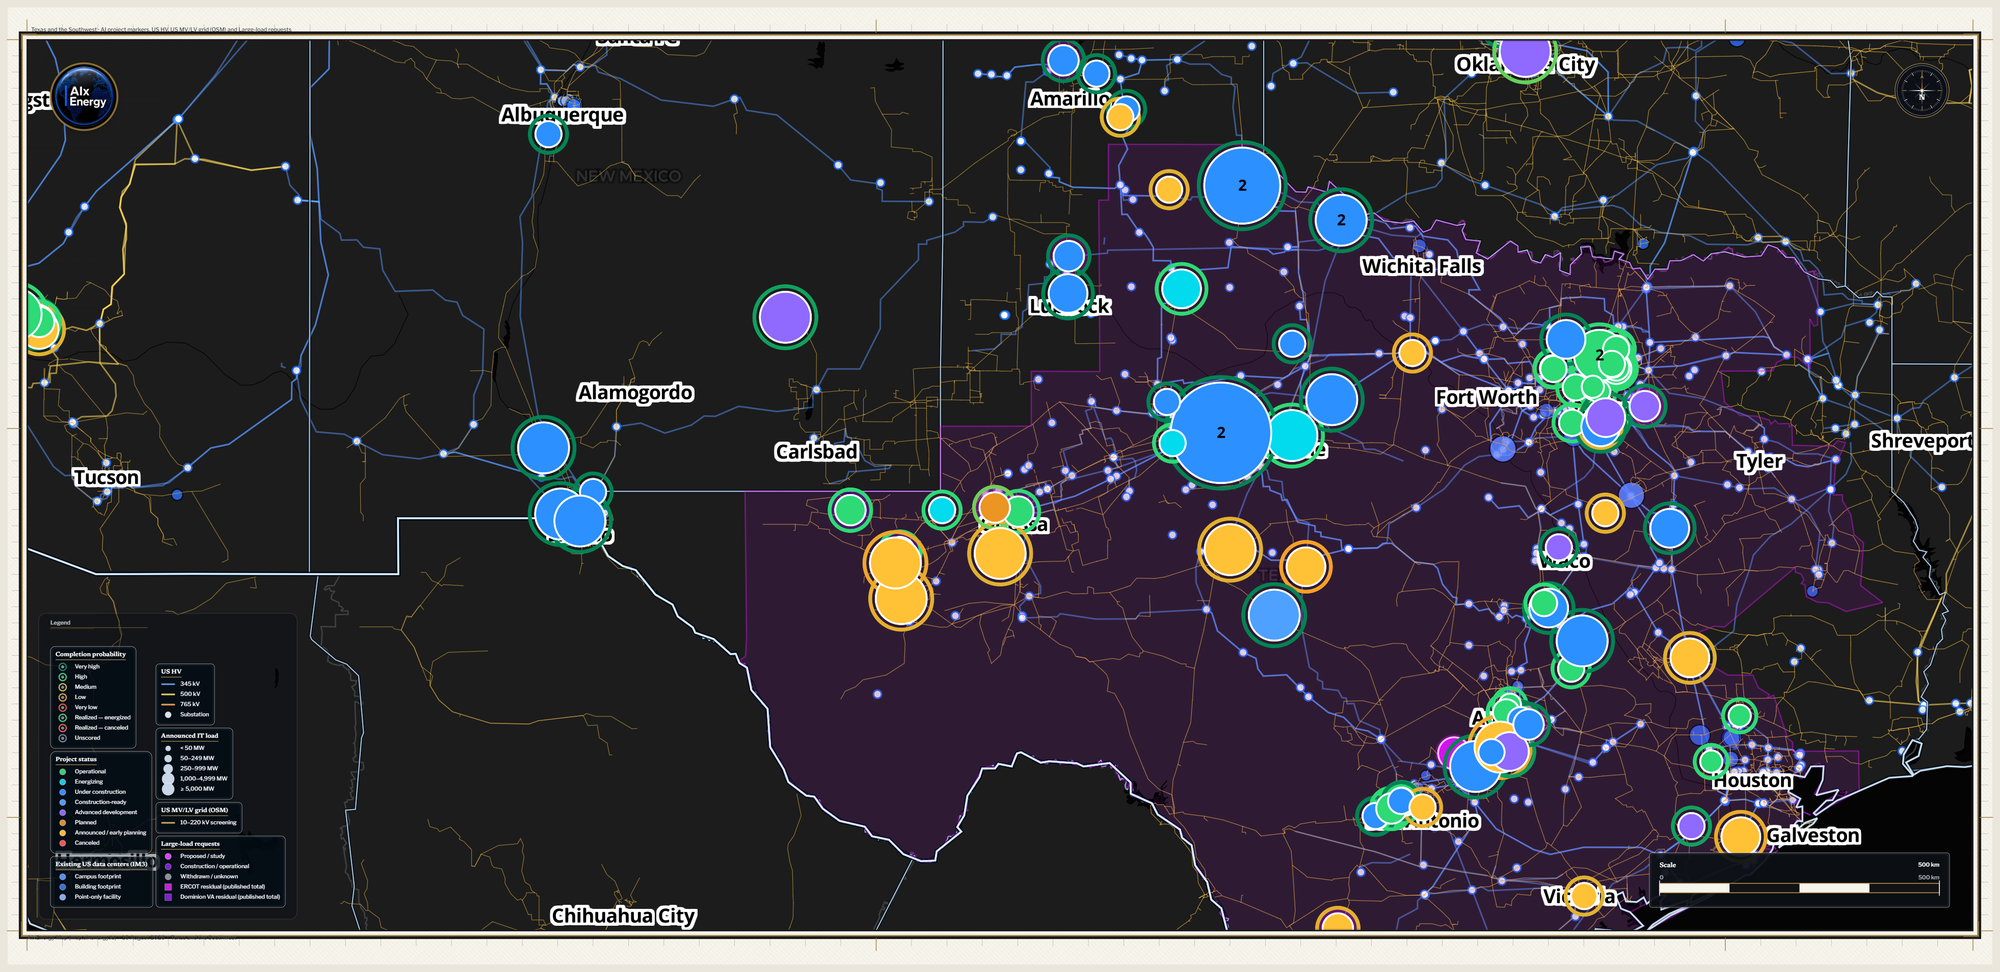
The current production catalog includes 83 map layers across eight categories, spanning AI and large-load projects, site screening, transmission and interconnection, electricity markets, generation, environmental constraints, policy, fuel infrastructure, and connectivity.
The objective is to make the relationships between those datasets useful for site selection, infrastructure planning, market intelligence, investment diligence, and large-load strategy, spanning AI and large-load projects, site screening, transmission and interconnection, electricity markets, generation, environmental constraints, policy, fuel infrastructure, and connectivity.
| Rank | Layer | Source / type | Access | Layer details |
|---|---|---|---|---|
| 1. Projects & facilities · 3 layers Curated AI infrastructure (status fill, PCP border) and published existing US facilities. | ||||
| 1 | projects | AIx | Showcase | What it showsCurated AI-infrastructure markers from the private Project Keystone workbook, serialized through scripts/build_data.py under an explicit public-field whitelist. Marker fill is normalized public_status (Operational, Energizing, Under construction, Construction-ready, Advanced development, Planned, Announced / early planning, Canceled). Marker border is Project Completion Probability (PCP-1.1.0). Click a marker for Project Intelligence: overview, infrastructure, diligence, evidence, power, environment, site, and market — plus ranked advantages/constraints with “show on map” actions.Decision useWhere documented AI / large-load infrastructure is, how far it has progressed, how complete the evidence is, and how first energization screens. Use filters (status, company, geography, business model, evidence, PCP band, MW, capex) and shareable URLs. Pair with demand, queues, HV, water, and policy — the atlas is the reason those surfaces are commercially interesting. What it is notA complete census of every rumor. Parcel-accurate siting. Underwriting. A COD, financing outcome, or credit rating. The probability that announced IT load or capex will be fully delivered. Linked queue IDs are associated published requests, not proof the campus holds that interconnection position. Coordinates are approximate (site, city, regional, campus, or portfolio centroids). |
| 2 | im3-datacenters | PNNL | Public | What it showsPNNL IM3 Open Source Data Center Atlas — an OSM-derived inventory of published existing US facilities. Point markers at continental zoom; footprints from zoom 8+. Decision useContrast the announced / pipeline atlas against the broader operating US footprint — “what is already here?” versus “what is being proposed?” What it is notThe AIxEnergy project list. Entitlement, capacity, IT load, or AIxEnergy research status. |
| 3 | project-labels | AIx | Showcase | What it showsCurated project names beside markers at closer zoom so dense clusters remain readable. Decision useReading campus names when presenting or sharing a regional view. What it is notA separate dataset. |
| 2. AIxEnergy screening · 11 layers Proprietary indices for site, climate, water, permitting, tariffs, fiber, BTM, grid-shock, and U.S. state attractiveness. Missing inputs are omitted and remaining weights renormalize. Blanks are never coerced to zero. Not parcel feasibility. | ||||
| 1 | site-score-us CSS-US-0.25-4.0.0 | AIx | Showcase | What it showsCSS-4.0.0 on a 0.25° US land grid (0–100; higher = more favorable relative suitability). Click a cell for the research dossier and factor breakdown. On-demand Parcel Research pages public county GIS for the in-cell inventory and ranks a top-100 shortlist joined to cell power and fiber signals. Decision useFirst-pass physical screen for a 100–500 MW campus. Site Screening view is cell-first (atlas off) so the score is readable. Then pin-drop or parcel research inside a shortlisted cell. What it is notParcel feasibility, buildable acreage, a survey, entitlement, interconnect rights, or bankable siting. Published queues inside power access are generation/storage-dominated, not data-center large-load queues. Cell aggregates are not POI-accurate wait times. |
| 2 | site-score-eu CSS-EU-0.25-4.0.0 | AIx | Map | What it showsCSS-4.0.0 on the Europe bidding-zone densify grid. Same 0–100 language and cell dossier as the US product. Decision useComparative European shortlists alongside CCI, SFCI, and market layers. What it is notParcel feasibility, an ENTSO-E planning model, or interconnect rights. |
| 3 | large-load-tariff LLCCI | AIx | Journal | What it showsLLCCI applicability areas with embedded tariff-record metadata for hyperscale / large-load rate constructs. Click an area for the tabbed dossier of curated tariff evidence. Decision useWhether a special large-load rate construct appears to apply before you hire rate counsel. What it is notA binding quote, negotiated hyperscale rate, service-territory guarantee, or complete tariff library. |
| 4 | btm-configuration BTM-CFG-1.1.0 | AIx | Journal | What it showsBTM-CFG-1.1.0 categorical heatmap of the lowest firm $/MWh mix for a flat 24/7 AI load on a closed 24-hour typical day. Popup: winning archetype and a mix vector per 100 MW IT at 100% load factor. Decision useWhich firm mix screens cheapest when the grid alone is expensive or tight. Pair with GDPI, US gas pipelines, and C&I retail. What it is notA dispatch model, capacity-expansion MILP, TMY coincidence study, PPA, interconnect rights, firm laterals, global buildable acres, or bankable LCOE. |
| 5 | permitting-jurisdictions PFI | AIx | Journal | What it showsPFI relative entitlement-friction score by ADM2-scale jurisdiction (county / equivalent). Higher friction = comparatively harder permitting screen. Decision useCompare jurisdictions early in site selection — before local counsel is hired. What it is notA legal opinion, zoning certainty, entitlement forecast, or substitute for counsel. |
| 6 | water-territories CWAF | AIx | Journal | What it showsCWAF relative difficulty of cooling-water access by water-utility territory polygon. Decision useFlag territories where cooling-water access may be harder relative to peers. Cooling Water Access view keeps the project atlas on. What it is notA water right, well permit, will-serve letter, plant water balance, or guarantee of supply. |
| 7 | btm-gas-favorability BTM-GAS-1.0.0 | AIx | Journal | What it showsBTM-GAS-1.0.0 pipeline-gated spark-spread heatmap in USD/MWh. Green = industrial retail exceeds all-in BTM gas (attractive for on-site gas). Red = BTM gas is more costly than the prevailing C&I rate. Decision useWhether behind-the-meter gas screens cheaper than industrial retail on a typical day — the binary companion to BTM-CFG’s mix question. What it is notA PPA, heat-rate guarantee, firm gas capacity, laterals study, negotiated large-load tariff, or bankable LCOE. |
| 8 | cooling-climate CCI | AIx | Journal | What it showsCCI 0–100 thermal-suitability raster (higher = more favorable for cooling / free-cooling). Styled XYZ PNG tiles z0–z7. Decision useWhether climate favors air, evaporative, or water-intensive cooling — portfolio screen, not mechanical design. What it is notA facility energy model, PUE forecast, ASHRAE design study, live weather, climate-change projection, or a statement about power, water rights, or policy. |
| 9 | fiber-corridor SFCI-1.2.0 | AIx | Journal | What it showsSFCI-1.2.0 relative corridor-capacity index (0–100) on a land-aware 0.5° graph. Popup: capacity index, corridor score, hub-access proxy (km), corroboration flag. Decision useWhether digital-infrastructure access screens as a corridor, not a last-mile claim. Fiber Availability view. Used as a CSS factor (weight 0.125). What it is notLit fiber, carrier routes, ownership, latency, or measured bandwidth (Gbps). |
| 10 | us-state-attractiveness USPA-1.0.0 | AIx | Journal | What it showsUSPA-1.0.0 0–100 relative screen and dense rank #1–#50 across the 50 U.S. states. Color stretched across the score range. Click a state for narrative, pillar meters, and calculation. DC is computed for disclosure when inputs exist but is not ranked. Decision useState-level attractiveness before cell- and project-level work. Then go to CSS and the atlas inside the shortlisted state. What it is notA site score, a county ranking, parcel feasibility, interconnection position, negotiated tariffs, or project-success probability. |
| 11 | grid-shock Grid Shock v0.5 | AIx | Journal | What it showsCurated atlas of documented large load-transfer / grid-shock episodes. City-scale references (not exact substations). Sized and colored by observed MW. Markers and rings are cartographic emphasis. Decision useWhere the grid has already absorbed a sudden large transfer — historical context for PJM, Dublin, and peer events. What it is notA substation-level reliability study, voltage contour, or campus footprint. |
| 3. Transmission & interconnection · 11 layers HV/MV corridors, ISO day-ahead constraints, nodal LMP, interchange, queue stress, and published interconnection requests. | ||||
| 1 | large-load-queue | AIx | Showcase | What it showsClassified national layer ≥50 MW (LLQ-1.3.0). Magenta markers with ice-white strokes sit on the teal-to-crimson generation-queue heatmap; names from zoom 6. Market-sizing slider scales bubbles by requested MW (blank MW is not zero). Popup record class says which kind of feature you clicked. ERCOT and Dominion published residuals render as light territory fills. Decision useWhere competing large load is published — and which class the feature is. Analysis: projects near a published request (≤50 km) or inside a residual polygon. What it is notA complete US utility-portal harvest. A residual polygon is not a named request. An announced campus is not a utility queue row. |
| 2 | ix-queue | AIx | Showcase | What it showsPublished ISO/RTO/utility generation and storage queue requests. Teal = lighter pressure; gold through crimson = jammed clusters (same cool-to-hot language as nodal DA LMP). Heatmap below zoom 8; inspectable points when closer. Click a request for the interconnection dossier (overview, member requests, stress, grid, evidence) and printable report. Decision useRelative access/stress screen and published-request proximity. Analysis can screen PCP × queue — higher-completion-probability campuses that also sit near published queue activity (timing risk, not a queue seat). What it is notA queue position, POI-accurate wait time, deliverability study, or the large-load layer. |
| 3 | us-nodal-lmp | AIx | Showcase | What it showsDay-ahead nodal LMP at HIFLD substations ≥69 kV, colored USD/MWh (teal cheap → crimson expensive). Subtle 0.25° cells where load-side congestion or ISO-basis premium is elevated (moderate / high / severe only). Unpainted cells are unknown, not unstressed. Unmatched pnodes omitted. Decision usePrice context at matched nodes next to constraints and the pipeline. Cheap is not available capacity. What it is notWall-to-wall nodal coverage, a feeder tariff, line loading, ATC, interconnect rights, or a licensed EMS/CIM map. Constraints are not prices. |
| 4 | transmission-constraints | AIx | Map | What it showsISO day-ahead binding constraints and shadow prices, name-matched to HIFLD substations ≥115 kV in the same ISO/RTO. HV corridor lines only when from and to both match a HIFLD ≥115 kV line within ~5 km. Otherwise a substation pin or a jittered ISO-region gray dot (unlocated fallback — not a constrained POI). Straight station-to-station chords are not drawn. A name hit in another ISO is rejected. Decision useDocumented congestion exposure near a site or campus. What it is notMeasured line loading, ATC, MV/LV distribution congestion, an EMS/CIM map, or a constrained POI (gray dots). |
| 5 | us-hv | HIFLD | Public | What it showsHIFLD transmission lines and substations at ≥345 kV, simplified for web-map performance. Decision usePlausible extra-high-voltage access. Near is not interconnected. What it is notInterconnection, spare MVA, CEII ratings, a power-flow model, or a NERC compliance model. |
| 6 | transmission-flows | AIx | Map | What it showsEIA-930 hourly actual BA-to-BA interchange (Form 930), not day-ahead schedules. Clock is hour-ending HE 1–24 in the reporting BA’s local time; the latest published hour is labeled. Schematic arrows on shared BA borders. Averages: 7-day, 30-day, YTD, trailing-12-month, weekday on-peak (HE 7–22), off-peak, summer / winter / spring, and a 30-day typical-hour (diurnal) mean. Arrowheads follow the latest hour; a reversing average is shown on the label. ISO/RTO labels (CAISO, ERCOT, ISO-NE, MISO, NYISO, PJM, SPP, plus Ontario IESO) show that BA’s net for the selected clock. Decision useWhich regions are leaning on which neighbors — energy tightness around AI load. What it is notCampus deliverability, ATC, a power-flow model, an EMS map, or line ratings. Schematic arrows are not electrical paths. Blank MW is unknown. |
| 7 | planned-transmission | HIFLD | Public | What it showsHIFLD under-construction / proposed lines ≥115 kV plus optional curated ISO plan extracts (RTEP / MTEP / RPG shapefiles dropped in private-source/planned-transmission/).Decision useWhether a corridor is already under construction — a timing signal next to today’s HV grid and binding constraints. What it is notA certain 2028–2032 grid. Proposed is not constructed capacity. |
| 8 | lbnl-queued-up | LBNL | Public | What it showsLawrence Berkeley National Lab Queued Up — county-level generation and storage queue MW summaries. Decision useCompare generation/storage queue intensity by county (order-of-magnitude FoM). What it is notData-center or large-load queues. Individual queue positions. |
| 9 | europe-hv | OSM | Public | What it showsPyPSA-Eur / OSM transmission and substations at ≥220 kV. Decision useEuropean extra-high-voltage context beside bidding zones and prices. What it is notAn ENTSO-E planning model, TSO map, or interconnection study. |
| 10 | osm-power-lines | OSM | Public | What it showsOpenStreetMap power=line features worldwide at ≥220 kV. Complements curated US/EU HV extracts.Decision useWorldwide HV screening backdrop (Global Power Prices / Global Power System views). What it is notA complete global transmission inventory, utility asset register, power-flow model, or interconnect rights. |
| 11 | osm-mv-power-lines | OSM | Public | What it showsOpenStreetMap mid/low-voltage lines via OpenInfraMap vector tiles, filtered to 10 kV ≤ voltage < 220 kV (the ≥220 kV OSM overlay is separate). Decision useSubtransmission / distribution context when zoomed into a candidate pad. What it is notA utility GIS extract or complete distribution model. |
| 4. Generation & markets · 12 layers Electricity demand, operating and planned generation, utility territories, and wholesale / retail price surfaces. | ||||
| 1 | electricity-demand | AIx | Showcase | What it showsEDM-1.4.0 hex demand nodes: annual MWh, average MW, estimated coincident peak MW, sector mix (residential, commercial, industrial, existing data centers, transportation, other), confidence, and — in 2030 — proposed and expected AI load. Click a hex for the demand dossier; nearby atlas projects within ~50 km are listed. Year rail, Growth view, and 2030 AI scenario. Decision useWhere existing peak, organic growth, and expected AI load stack — and which hexes would be overwhelmed by the announced pipeline. What it is notMeters, feeders, a utility allocation, or interconnect rights. |
| 2 | ci-retail-prices | AIx | Map | What it shows2024 USD/MWh heat map of typical commercial and industrial retail rates. Click a jurisdiction for values and source notes. Decision useTypical C&I retail cost by utility / jurisdiction — the retail side of every BTM and CSS screen. What it is notA negotiated large-load rate. Averages can mask LLCCI constructs. |
| 3 | utility-territories | HIFLD | Public | What it showsApproximate retail utility footprints (EIA-861 / HIFLD lineage), simplified for web display. Decision useWho serves the site — the geography for tariff, demand, and large-load residual screens. What it is notA legal franchise map, will-serve, or rate schedule. |
| 4 | eia-us-power-plants | EIA | Public | What it showsPlant-aggregated EIA-860M inventory. Existing ≥50 MW = filled circles; planned ≥20 MW = hollow rings; retired ≥50 MW since 2002 = muted. Fuel color on existing/planned; size ∝ disclosed capacity. Optional color by capacity factor, CO₂ intensity, or annual generation — gray is unknown, not zero. Click for EIA-923 plant/prime-mover net generation and electric fuel (latest complete year) plus EPA eGRID annual CO₂ / NOx / SO₂ rates (lb/MWh) when Plant ID joins. Decision useSupply mix, output, and emissions context around a site. What it is notA production-cost model. |
| 5 | energy-storage | AIx | Map | What it showsEIA-860M batteries and pumped storage plus active published interconnection-queue BESS/hybrid requests. Heatmap below zoom 8; circles from zoom 5. MWh blank when unpublished. Decision useOperating, planned, and queued storage near the pipeline. What it is notA new storage database or a duration guarantee. LBNL county storage_mw stays on Queued Up. |
| 6 | us-da-prices | AIx | Map | What it showsUSD/MWh heatmap of ISO zone/hub averages with labeled centroids — not nodal settlement. Decision useComparative wholesale cost context at zone/hub scale. What it is notA hyperscale tariff, nodal LMP series, forward curve, or bilateral quote. |
| 7 | us-iso-rto | AIx | Map | What it showsCurated market-region footprints from public ISO/RTO boundary materials. Decision useWhich organized market the site sits in. What it is notA nodal model or the official ISO footprint for filings. Confirm with the ISO. |
| 8 | europe-da-prices | AIx | Map | What it showsEUR/MWh heatmap of bidding-zone averages with labeled centroids (Energy-Charts / Fraunhofer-style public feeds). Decision useEuropean wholesale context. What it is notA trading feed, imbalance price, PPA, or industrial tariff. |
| 9 | europe-bidding-zones | ENTSO-E | Public | What it showsENTSO-E community bidding-zone boundaries — the spatial scaffold for European DA prices and CSS-EU densify. Decision useZone orientation and price overlays. What it is notA price or a complete market-rules reference. |
| 10 | intl-da-prices | AIx | Map | What it showsRegional spot heatmap where public feeds exist, with labeled centroids. Decision useNon-US/EU wholesale context where a feed exists. What it is notA universal price surface, trading feed, or bilateral quote. |
| 11 | power-plants | AIx | Map | What it showsGlobal generation points ≥100 MW: US EIA-860M existing + WRI Global Power Plant Database non-US. Capacity and fuel where disclosed. Decision useProximity to large existing generation outside the detailed EIA-860M US layer. What it is notA complete small-plant inventory. |
| 12 | eia-us-power-plant-labels | EIA | Public | What it showsEIA-860M plant names beside markers when zoomed in. Decision useReading plant names on a regional plate. What it is notA separate dataset. |
| 5. Environment & land · 17 layers Population, buildings, water, hazard, land cover, and siting-constraint screens. Ranked by how often the overlay kills or reshapes a 100–500 MW shortlist. | ||||
| 1 | water-stress | WRI | Public | What it showsWRI Aqueduct baseline water stress at watershed scale. Decision useWhether evaporative or water-intensive cooling is even plausible at basin scale. What it is notA water right, cooling-water capacity, facility water use, or future climate hydrology. |
| 2 | flood-nfhl | FEMA | Public | What it showsFEMA National Flood Hazard Layer Flood Hazard Zones. Decision useUS flood-zone screening for pad and insurance friction. What it is notSFHA delineation, FIRM determination, or flood insurance rating. |
| 3 | nwi-wetlands | USFWS | Public | What it showsUSFWS National Wetlands Inventory classed presence: estuarine, freshwater emergent/forested, pond, lake, riverine, other. Decision useWetland-presence screen that can exclude a CSS cell. What it is notA Clean Water Act jurisdictional delineation or field-verified boundary. |
| 4 | slope | USGS | Public | What it showsUSGS 3DEP Slope Map (flat gray → yellow → red-brown), proxied as PNG tiles. Decision useGradeability triage for a campus pad. What it is notA topographic survey, cut/fill, or pad engineering study. |
| 5 | groundwater-basins | USGS | Public | What it showsUSGS Principal Aquifers (2003) outcrop and subcrop. Color is rock group. Aqueduct BWS is sampled at each aquifer centroid for basin-stress context only. Decision useWhether a principal aquifer is present — the third water question after basin stress and territory friction. What it is notA water right, well permit, AMA overlay, or confirmed industrial yield. Centroid BWS is not groundwater availability. |
| 6 | wildfire-whp | USFS | Public | What it showsUSFS RMRS Wildfire Hazard Potential Classified 2023. Decision useLandscape wildfire potential for campus and corridor risk. What it is notA seasonal forecast, ignition outlook, or First Street property-level product. |
| 7 | epa-nonattainment | EPA | Public | What it showsEPA OAQPS nonattainment polygons (NAAQS / Green Book) — ozone, PM2.5, and other criteria pollutants. Decision useWhether Clean Air Act nonattainment adds permitting friction. What it is notA permit decision, BACT determination, PSD applicability opinion, or facility ambient monitoring. |
| 8 | protected | OSM | Public | What it showsOpenStreetMap parks and reserves as a conservation-sensitive-land proxy. Decision useFlag likely constrained areas early. What it is notAn authoritative protected-area inventory or a legal setback. |
| 9 | natural-hazard | ThinkHazard | Public | What it showsThinkHazard! (GFDRR / World Bank) multi-hazard levels joined to administrative units. Decision useMulti-hazard first screen. What it is notSite-specific engineering risk, insurance pricing, or catastrophe modeling. |
| 10 | usa-structures | ORNL | Public | What it showsBuildings larger than 450 sq ft. Below zoom 12: buildings-per-km² mosaic/heatmap from count-only stats ( /api/tiles/buildings-stats). Zoom 12+: occupancy-colored footprints (/api/tiles/buildings-preview), largest first.Decision useExisting built fabric and occupancy mix around a candidate pad. What it is notParcel, title, or legal boundaries. |
| 11 | population | WorldPop | Public | What it showsWorldPop 2020 density heatmap via MapTiler tiles. Decision useLabor, community, and load-context screening. What it is notA census block, commuting study, or growth forecast. |
| 12 | quaternary-faults | USGS | Public | What it showsUSGS Quaternary Fault and Fold Database National layer ( show:21).Decision useFault-proximity screen. What it is notA seismic design study or design ground-motion analysis. |
| 13 | land-use | OSM | Public | What it showsOpenStreetMap industrial and commercial polygons via MapTiler OpenMapTiles. Decision useAlready-industrialized land context. What it is notZoning entitlement or parcel land-use codes. |
| 14 | airport-exclusion | AIx | Map | What it showsAIxEnergy 5 / 10 / 15 km rings around medium and large OurAirports sites. Decision useAirport-proximity friction for height and community screens. What it is notFAA/EASA obstacle surfaces, height limits, or permitting determinations. |
| 15 | grid-carbon-intensity | Ember | Public | What it showsEmber annual country electricity intensity (gCO₂eq/kWh) choropleth. Decision useBuyer Scope 2 / diligence screening. What it is notReal-time dispatch, balancing-authority intensity, or metered Scope 2. |
| 16 | canopy | ETH | Public | What it showsETH Global Canopy Height 2020 (Lang et al. 2023; CC BY 4.0) — satellite-estimated tree-canopy top height in meters. Decision useVegetation / clearing context. What it is notCorridor LiDAR or a NERC FAC-003 clearance determination. |
| 17 | cities | OSM | Public | What it showsOpenStreetMap place names via MapTiler OpenMapTiles. Decision usePlace-name orientation at mid zooms. What it is notA population ranking or labor-market product. |
| 6. Context & policy · 8 layers Policy atlases, pushback evidence, European protected sites, and basemap context. Policy and pushback carry the value; roads and rail are orientation. | ||||
| 1 | policy | AIx | Map | What it showsEvidence-graded constraint records joined to jurisdiction geometries: moratoria, pauses, restrictive postures, and related kinds. Features carry evidence metadata for the policy dossier. Decision useFormal policy / moratorium / restriction footprints before announcement. What it is notA legal opinion, exhaustive law, or political probability. Evidence grade is not the chance a rule survives. |
| 2 | pushback | AIx | Map | What it showsCurated protests, hearings, lawsuits, and opposition events tied to AI / data-center development, styled by recency. Decision useDocumented community or legal opposition — a social-license signal from public evidence. What it is notA complete news archive or a sentiment index. |
| 3 | eu-natura-2000 | EEA | Public | What it showsEEA Natura 2000 protected sites (SAC / SPA — Habitats and Birds Directives). Decision useEuropean protected-site friction on a shortlist. What it is notA permitting determination or Appropriate Assessment. |
| 4 | policy-labels | AIx | Map | What it showsJurisdiction names on constraint polygons when zoomed in. Decision useReading the constraint geography without opening every feature. What it is notA separate dataset. |
| 5 | boundaries | MapTiler | Public | What it showsCountry, state/province, and county lines from MapTiler / OpenMapTiles. Decision useOrientation and jurisdiction context. On in most Views. What it is notA cadastral or disputed-boundary product. |
| 6 | water-features | OSM | Public | What it showsRivers, lakes, and oceans from OpenStreetMap via MapTiler. Decision useSurface-water orientation. What it is notA water-right map, bathymetry, or floodplain. |
| 7 | roads | OSM | Public | What it showsHighways and local roads from OpenStreetMap via MapTiler. Decision useAccess and logistics context. What it is notA traffic or overweight-permit study. |
| 8 | rail | OSM | Public | What it showsOpenStreetMap rail lines — detail from zoom 8+. Decision useRail / ROW context for logistics and fiber-corridor proxies. What it is notOwnership, siding capacity, or freight rights. |
| 7. Fuel & renewables · 16 layers Gas corridors, coal and gas delivery prices, and renewable resource / plant screening. Not interconnect rights. Fuel-price fabrics (GDPI, CDPI) and corridor presence rank above resource rasters because they change a BTM or thermal-generation go / no-go. | ||||
| 1 | gas-delivery-prices | AIx | Map | What it showsGDPI heatmap: US citygate + EU industrial region fills, hub and citygate point labels in USD/MMBtu, schematic corridor-basis spines. Click for USD/MMBtu, HHV MWh, basis versus Henry Hub, cadence, source, and nearest pipeline snap. Decision useFuel-price context for BTM and industrial siting. Gates BTM-GAS (nearest GDPI price; else hub within 400 km). What it is notFirm delivered meter prices. Corridor spines are schematic — not metered routes or interconnect rights. Pipeline snap is proximity only. |
| 2 | coal-delivery-prices | AIx | Map | What it showsCDPI — companion coal-price fabric to GDPI in a common USD/MMBtu language (also tonne, short ton, and HHV MWh). US delivered-to-electric choropleth fills; producer-country FOB fills; seaborne and US basin hub markers; schematic rail/seaborne spines. Year/month vintage slider restyles hubs, fills, and spines from coal-price-history/timeline.json using the latest observation on or before the selected date. Click for price, vintage, observed date, industrial SEDS where attached, basis versus Newcastle, cadence, and source.Decision useThermal-fuel price context beside GDPI — seaborne FOB versus US delivered-electric, and how that spread has moved. What it is notMine-specific contracts, firm rail/terminal rights, or daily API2 / API4 / NEWC prints. Energy Institute markers are annual S&P-based averages republished by OWID. EIA weekly coal commodity spots are S&P-proprietary and are not redistributed. Withheld EPM cells stay blank unless a documented fallback exists — never coerced to zero. Corridor spines are schematic. |
| 3 | gas-us | EIA | Public | What it showsEIA / HIFLD interstate and intrastate transmission corridors. Decision useUS fuel-corridor proximity for behind-the-meter screens. What it is notA nomination, interconnect, pressure/capacity model, or engineering alignment. |
| 4 | gas-global | GEM | Public | What it showsGlobal Energy Monitor GGIT transmission routes. Decision useFuel-corridor presence worldwide. What it is notFirm capacity, lateral rights, or nomination availability. |
| 5 | gas-compressors | HIFLD | Public | What it showsHIFLD compressor stations along transmission corridors. Decision useCompression / delivery-point context. What it is notAvailable horsepower, spare capacity, or a gas-quality/offtake study. |
| 6 | gwa-us-wind | GWA | Public | What it showsGlobal Wind Atlas mean wind speed at 100 m for CONUS (~250 m source; regional PNG pyramid z0–z6). Decision useCONUS wind screen at a consistent global methodology. What it is notMicro-siting, IEC class certification, measured site wind, or bankable yield. |
| 7 | gsa-us-solar | GSA | Public | What it showsGlobal Solar Atlas PVOUT for CONUS (Solargis / World Bank). Decision useCONUS PV-output screen. What it is notInterconnect rights, plant design basis, or bankable production. |
| 8 | gwa-eu-wind | GWA | Public | What it showsSame GWA 100 m mean wind-speed product clipped to Europe (regional PNG; ~150 tiles). Decision useEuropean wind screen. What it is notA project resource assessment or grid connection. |
| 9 | gsa-eu-solar | GSA | Public | What it showsGSA PVOUT clipped to Europe (regional PNG; ~113 tiles). Decision useEuropean PV-output screen. What it is notInterconnect rights or engineered yield. |
| 10 | nrel-wind | NREL | Public | What it showsNREL Wind Toolkit fields served via Esri Living Atlas — a denser CONUS wind-resource screen than the GWA PNG pyramid. Decision useHigher-resolution US wind-resource screening when GWA’s ~250 m climatology is too coarse. What it is notMeasured site wind, wake-adjusted yield, or interconnectable capacity. |
| 11 | nsrdb-ghi | NREL | Public | What it showsNREL National Solar Radiation Database global horizontal irradiance at ~4 km. Decision useSolar-resource screen complementary to GSA PVOUT (irradiance vs. modeled PV output). What it is notPV layout yield, soiling, or interconnection. |
| 12 | gwa-global-wind | GWA | Public | What it showsNear-global Global Wind Atlas 100 m via Worker/R2 PMTiles ( /api/tiles/pmtiles/gwa-wind-100m/{z}/{x}/{y}).Decision useWorldwide wind backdrop outside US/EU packs. What it is notWall-to-wall met-mast truth, site measurement, or LCOE. |
| 13 | gsa-global-solar | GSA | Public | What it showsNear-global Global Solar Atlas PVOUT via Worker/R2 PMTiles ( /api/tiles/pmtiles/gsa-pvout/{z}/{x}/{y}).Decision useWorldwide solar backdrop outside US/EU packs. What it is notA bankable resource study or site-design irradiance. |
| 14 | us-wind-turbines | USGS | Public | What it showsUSGS US Wind Turbine Database (USWTDB) observed turbine locations. Decision useExisting wind-plant footprint context. What it is notA queue, a PPA, capacity-factor performance, or planned builds. |
| 15 | us-solar-plants | USGS | Public | What it showsUSGS US Large-Scale Solar Photovoltaic Database (USPVDB) plant locations and footprints where published. Decision useExisting utility-scale solar context. What it is notA queue, a PPA, or the planned pipeline. |
| 16 | rev-supply | NREL | Public | What it showsNREL reV LCOT / all-in LCOE centroids — approximate supply-cost geography. Decision useIndicative wind supply-cost geography. What it is notA site-specific LCOE, PPA offer, bid, or transmission deliverability study. |
| 8. Connectivity & fiber · 5 layers IX / cloud proximity, published fibre routes, and broadband availability. Synthetic fiber corridors (screening category) already carry the proprietary corridor-capacity claim; these layers are the published evidence underneath and around it. | ||||
| 1 | connectivity | AIx | Map | What it showsMerge of PeeringDB IXPs/facilities with curated cable landings and cloud-region points. The hub set used for proximity screening and SFCI pathing (3,252 terminals in the current SFCI build). Decision useDigital-infrastructure proximity for latency-sensitive campuses. What it is notA complete carrier inventory, a cross-connect, or a cloud on-ramp contract. |
| 2 | connectivity-rings | AIx | Map | What it showsAIxEnergy 25 / 50 / 100 km rings from curated cloud regions and IXPs. Decision useDistance bands to cloud and interconnection hubs. What it is notNetwork latency, fiber path length, or available capacity. |
| 3 | ofds-fiber | OFDS | Public | What it showsDigitized public operator fibre maps from the Open Fibre Data Standard corpus. Decision usePublished fibre-route proximity — corroboration for SFCI, not a substitute. What it is notA complete national fibre map or a lit wave. |
| 4 | tower-density | AIx | Map | What it showsAIxEnergy 0.25° density grid aggregated from OSM telecom towers. Decision useRelative terrestrial-wireless / infra activity. What it is notCoverage quality, 5G capacity, or a backhaul path. |
| 5 | us-broadband | FCC | Public | What it showsCounty-level FCC availability fraction. October 2020 vintage in the current packaging. Decision useCoarse last-mile availability context only. What it is notCurrent FCC fabric, FTTP, enterprise Ethernet, lit circuits, or dark fiber. |