The Shadow Grid: America’s Record Clean Energy Buildout — and the Parallel System Emerging Beside It
The U.S. plans to add 86 GW of utility-scale power in 2026—the largest annual expansion in decades—led by solar and battery storage. But a parallel wave of privately built, gas-fired generation for AI data centers is emerging beyond traditional grid reporting.

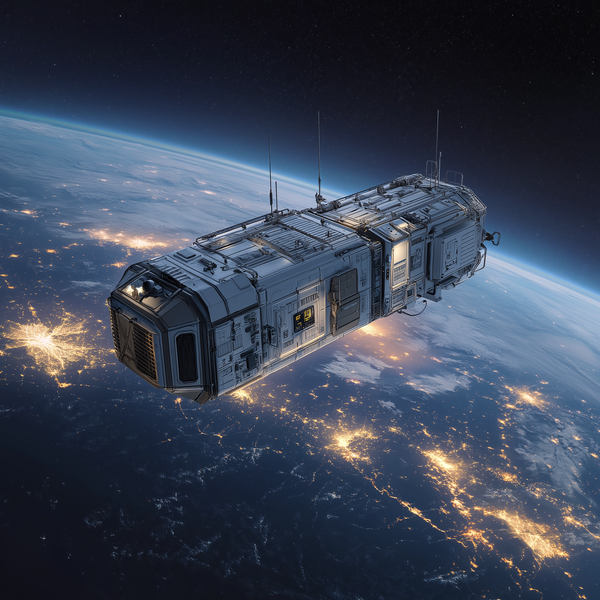
The New Geography of AI Infrastructure
AI is making computation physical again: global AI capacity will follow not just chips and fiber, but power, water, cooling, permits, grid reliability, and the emerging Shadow Grid that turns energy infrastructure into the new map of AI advantage.

Brandon Owens


AEO 2026 in Review: A Structural Shift in U.S. Energy System Dynamics
AEO2026 reframes its “Reference Case” as a control, not a forecast, and reveals a structural shift: electricity demand—driven by data centers and AI—is now the primary system variable, with load shape (continuous vs peak) redefining grid costs and planning
Brandon Owens