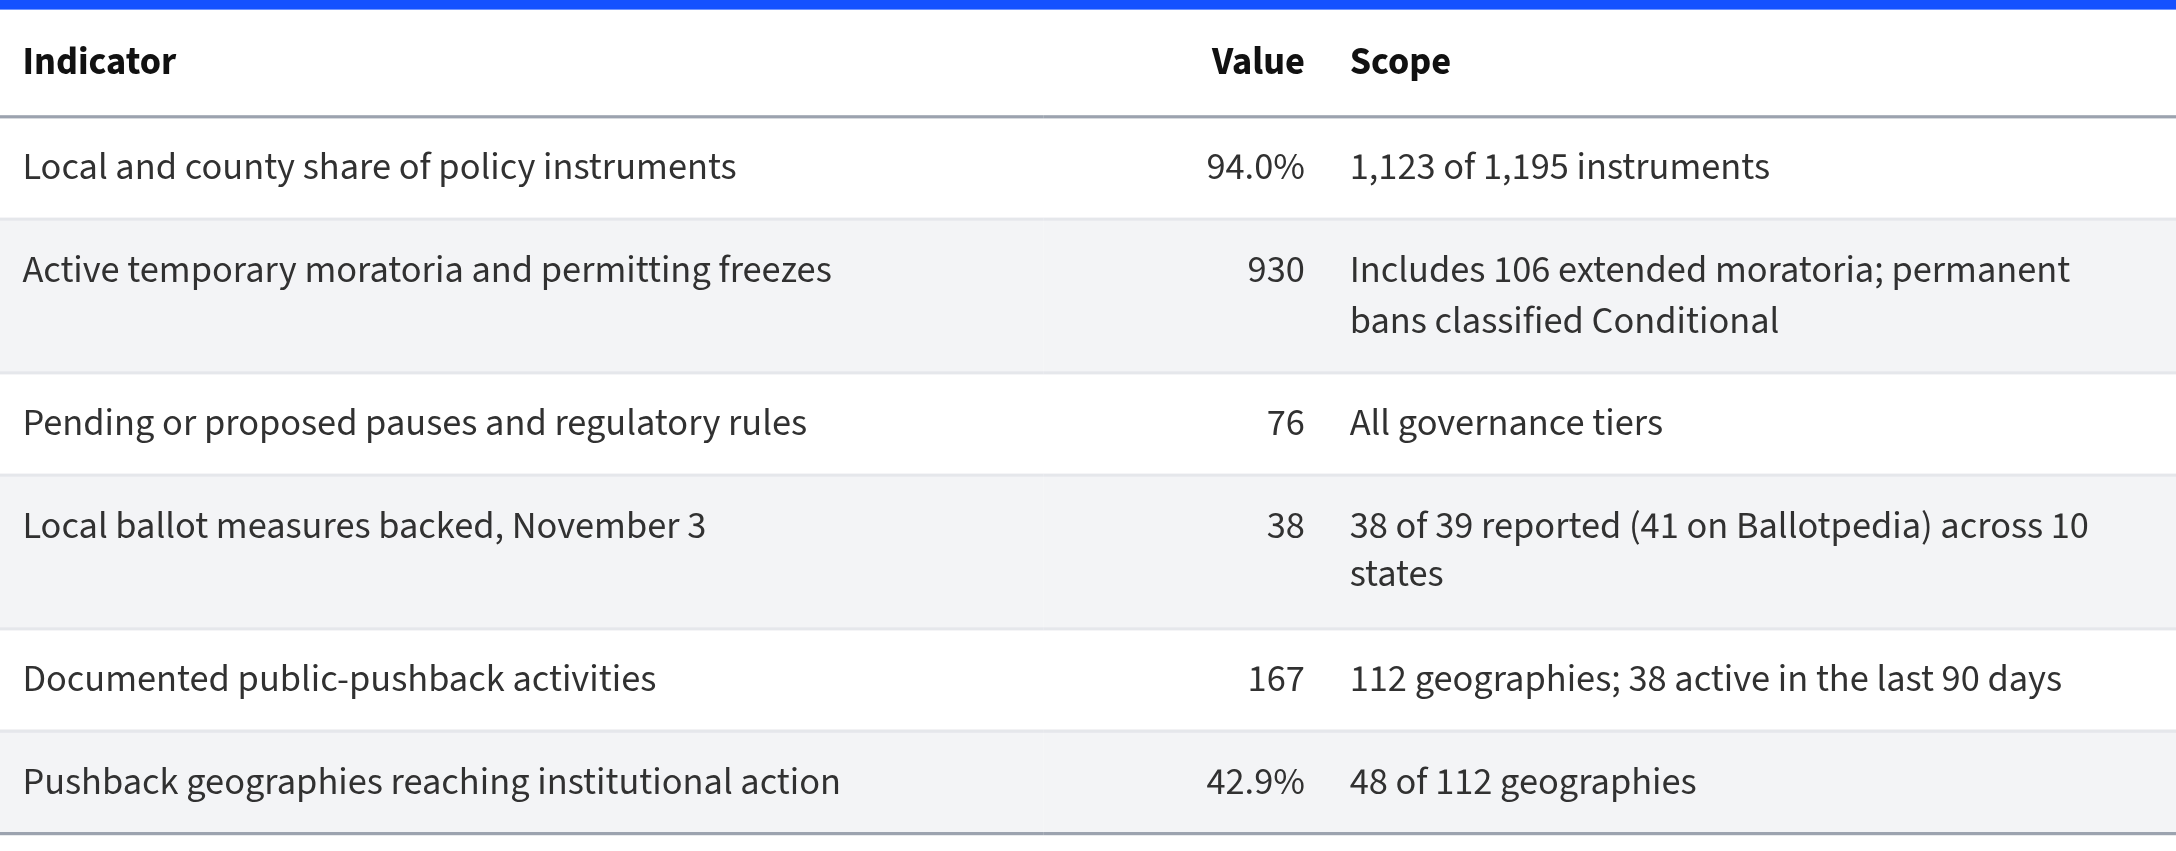
On election night in Sunbury, Ohio, roughly four-fifths of voters backed a charter amendment that bars data centers above 25 megawatts. Neighboring Pataskala and Granville passed related bans the same evening. Farther west, Alhambra, California, ratified a permanent citywide ban by a reported landslide near 82 percent. Six Maine towns approved moratoria or capacity limits. In Kansas, Emporia and El Dorado locked in ten-year bans keyed to load and water. Of the 41 local data-center measures Ballotpedia listed for November 3, 39 had been reported when the wire stories landed; 38 of those 39 went toward limits or bans. The results remain unofficial until certified.1,2
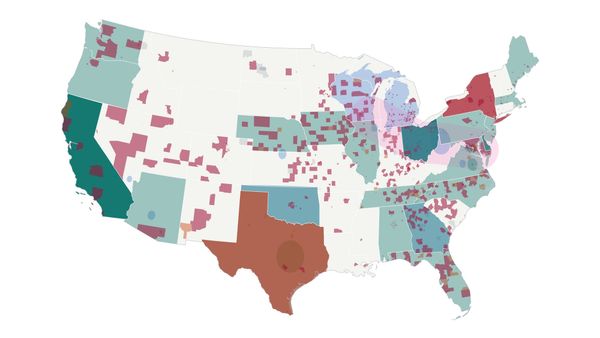
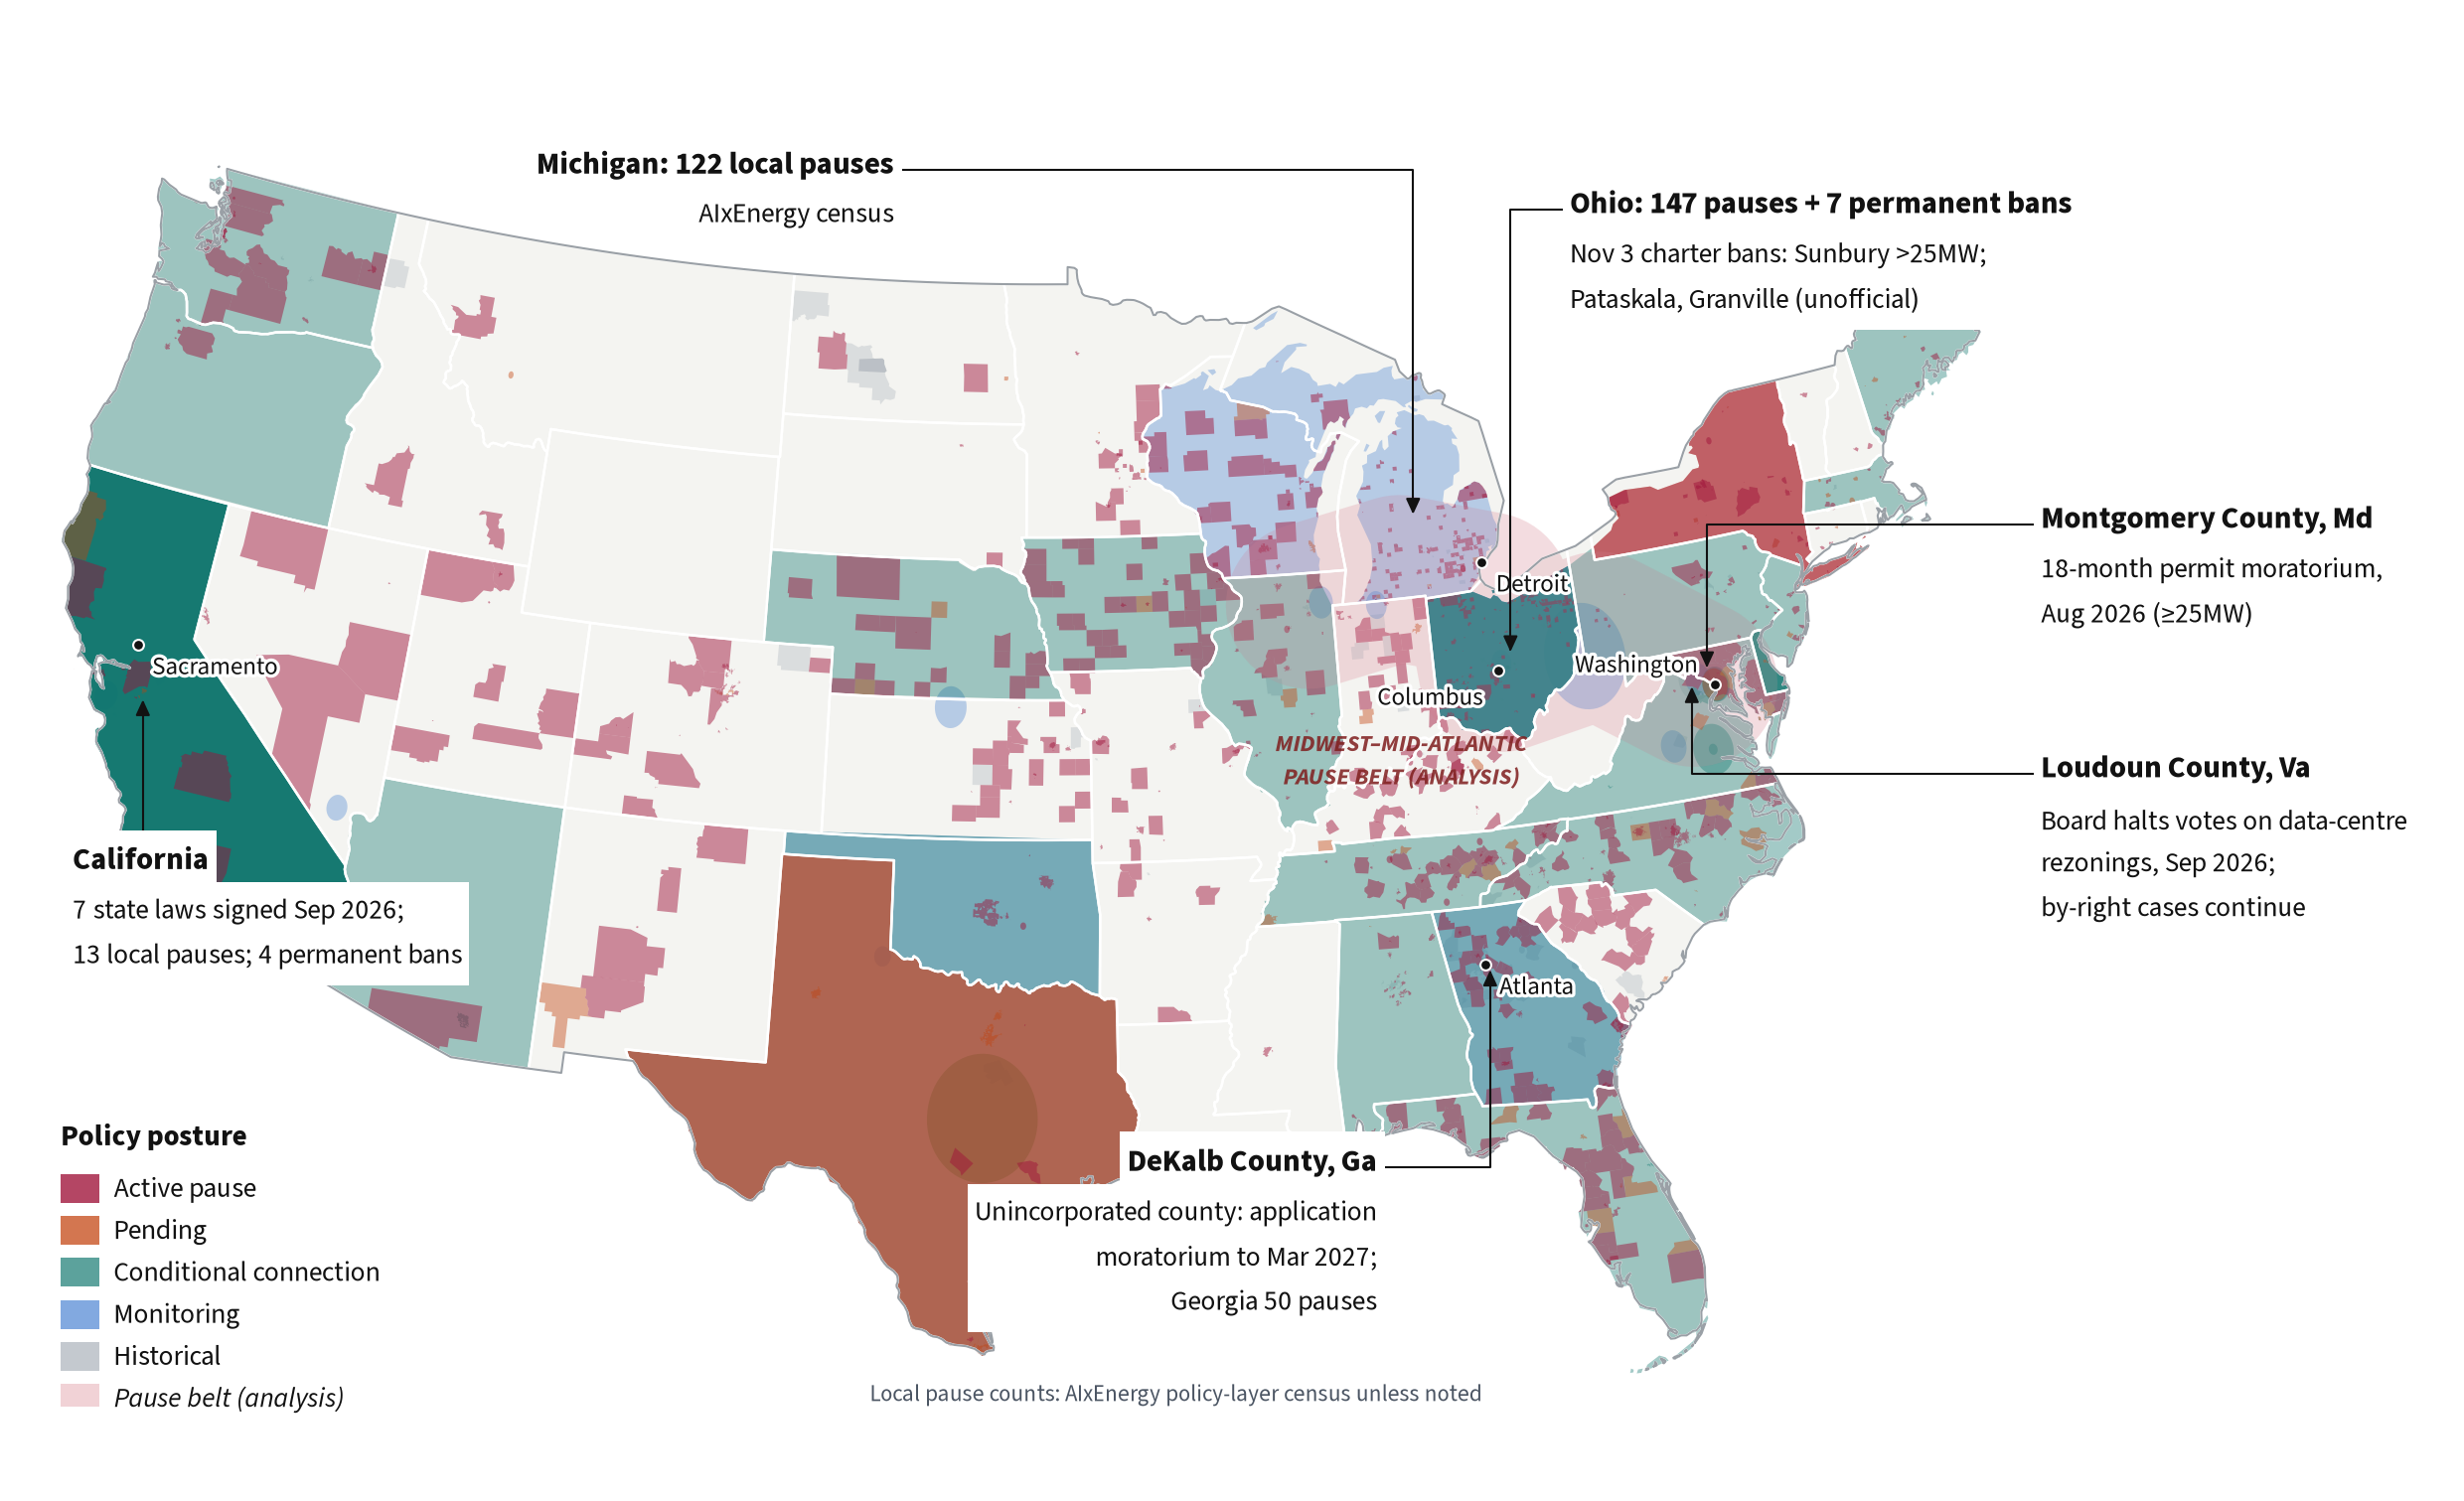
From Michigan’s townships through Ohio’s charter municipalities, across northern Kentucky and into the Virginia and Maryland counties that already hold much of the Mid-Atlantic campus inventory, temporary freezes and zoning stops sit denser than almost anywhere else in the contiguous United States. The map marks that strip with a soft editorial tint. We call it the Pause Belt. It is not a statute, not a regional transmission organization construct, and not a tally of megawatts lost. It is a geographic reading of where the freezes cluster.3,4
AIxEnergy now tracks 1,195 policy instruments. Local and county actions make up 94 percent of them. Nine hundred thirty are active temporary pauses or permitting freezes. Another 55 sit in what the layer calls Conditional: permanent charter bans, zoning prohibitions, and similar rules that condition or close access rather than stop the clock. Seventy-six instruments remain pending, 40 are monitoring watches, and 94 are historical.4 The Pause Belt is the densest patch of that inventory, not the whole of it.
The industry’s default story still treats “policy risk” as something that arrives from a state capitol or from the Federal Energy Regulatory Commission. The AIxEnergy policy census says otherwise. State and provincial records contribute one active pause. Federal and national records contribute one. The rest of the live freeze inventory is municipal, township, and county work: 507 active local pauses and 421 active county pauses, including 106 that have already been extended once.5
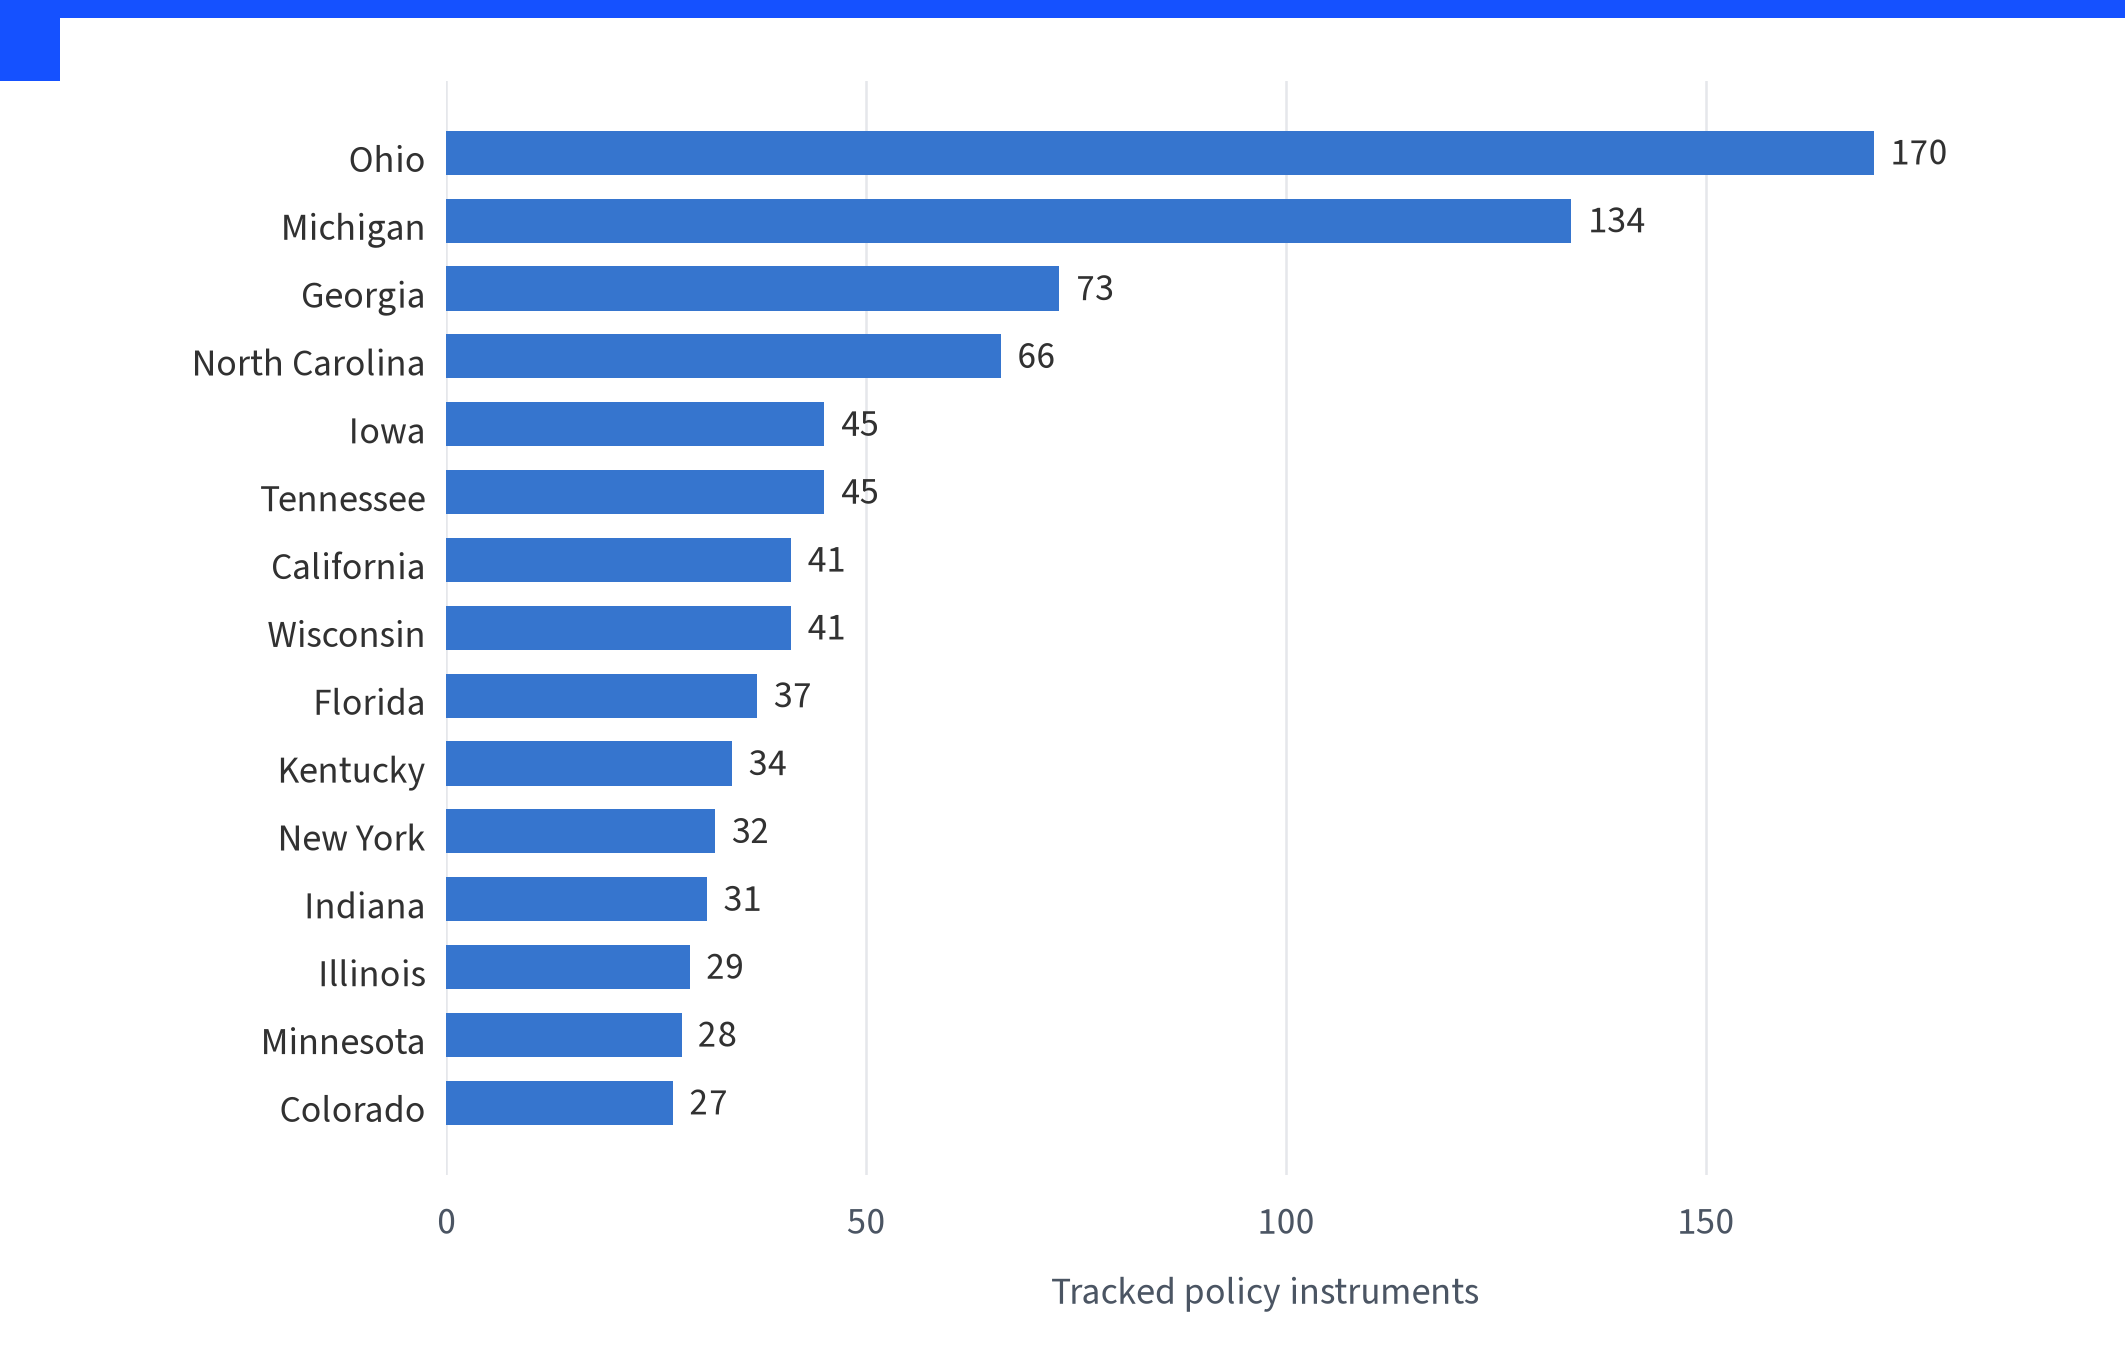
Ohio leads the state ranking with 170 tracked instruments and 147 active pauses, ahead of every independent floor we have found. The Ohio Capital Journal reported at least 138 municipalities and townships with active moratoriums as of September 17, and said the true count was likely higher.6 Michigan follows with 134 instruments and 122 active pauses. Georgia’s 73 instruments include 50 pauses; DeKalb County’s freeze on applications in unincorporated areas runs into March 2027. North Carolina, Iowa, Tennessee, California, Wisconsin, and Florida fill out the next tier. California’s profile is different again: thirteen local pauses, four permanent local bans, and seven statewide disclosure, ratepayer, and water statutes signed on September 21 that condition access rather than freeze siting.7,8
Inside the Mid-Atlantic arm of the belt, two county votes have become shorthand for developers who once treated Northern Virginia and suburban Maryland as reliable. On September 16, Loudoun County’s Board of Supervisors voted 7–1–1 to pause its consideration of certain legislative applications for data centers and substations. Applications still come in and get processed, by-right cases continue, and the memorializing resolution was still pending as of early November.9 Montgomery County, Maryland, went further on permits. Expedited Bill 19-26, effective August 10, tells the Department of Permitting Services not to accept, review, or issue building or grading permits for data centers of 25 megawatts or more for eighteen months.10
So the Pause Belt is two things at once. In the Midwest it is a density of township and city freezes, thickest in Ohio and Michigan. In the Mid-Atlantic it is a county problem sitting on top of the country’s densest existing campus stack.3
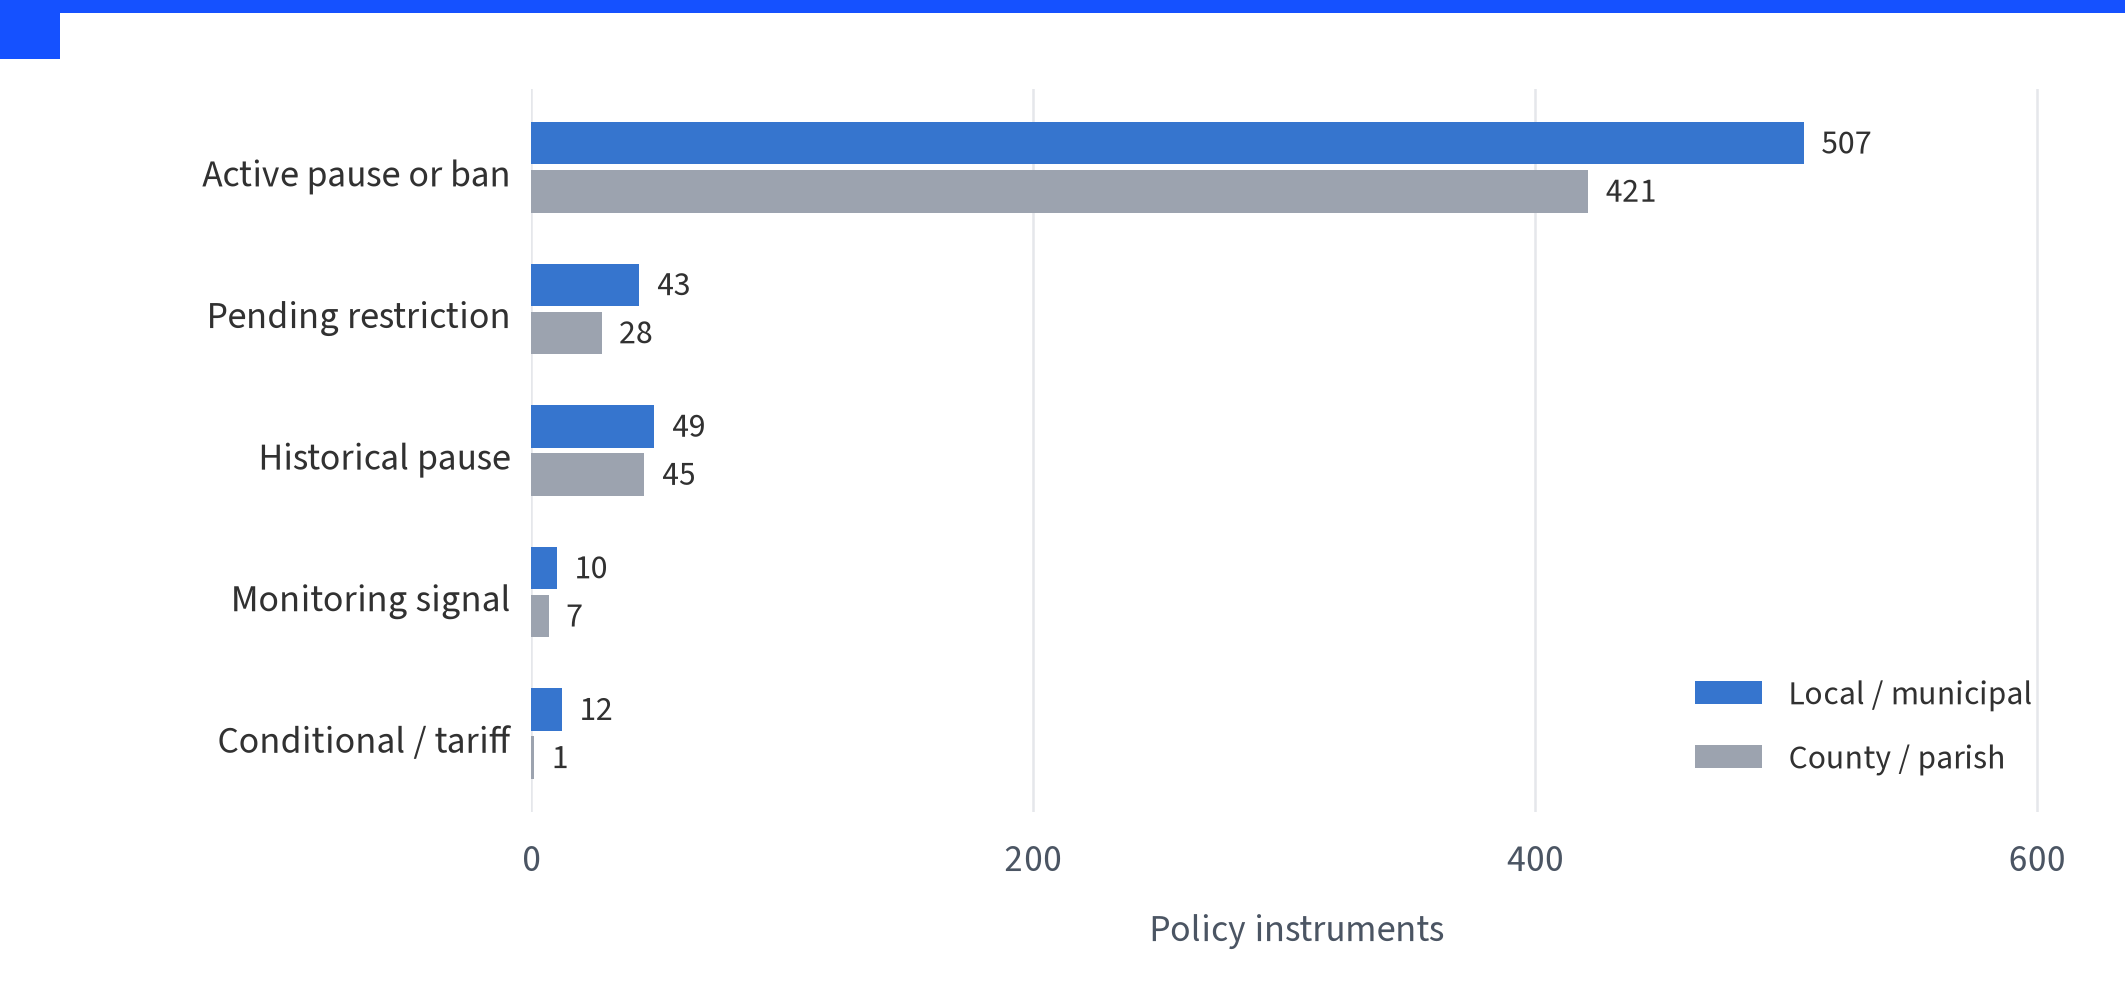
What local and county inventories share is posture. Active pauses dominate both: 507 of 621 local instruments and 421 of 502 county instruments. Pending votes and referrals are a thin slice. Historical records show the exits that already exist: replacement by permanent zoning, expiry of urgency ordinances, occasional rescission. A temporary pause is not automatically a soft no. In enough places it is the waiting room for a harder one.11
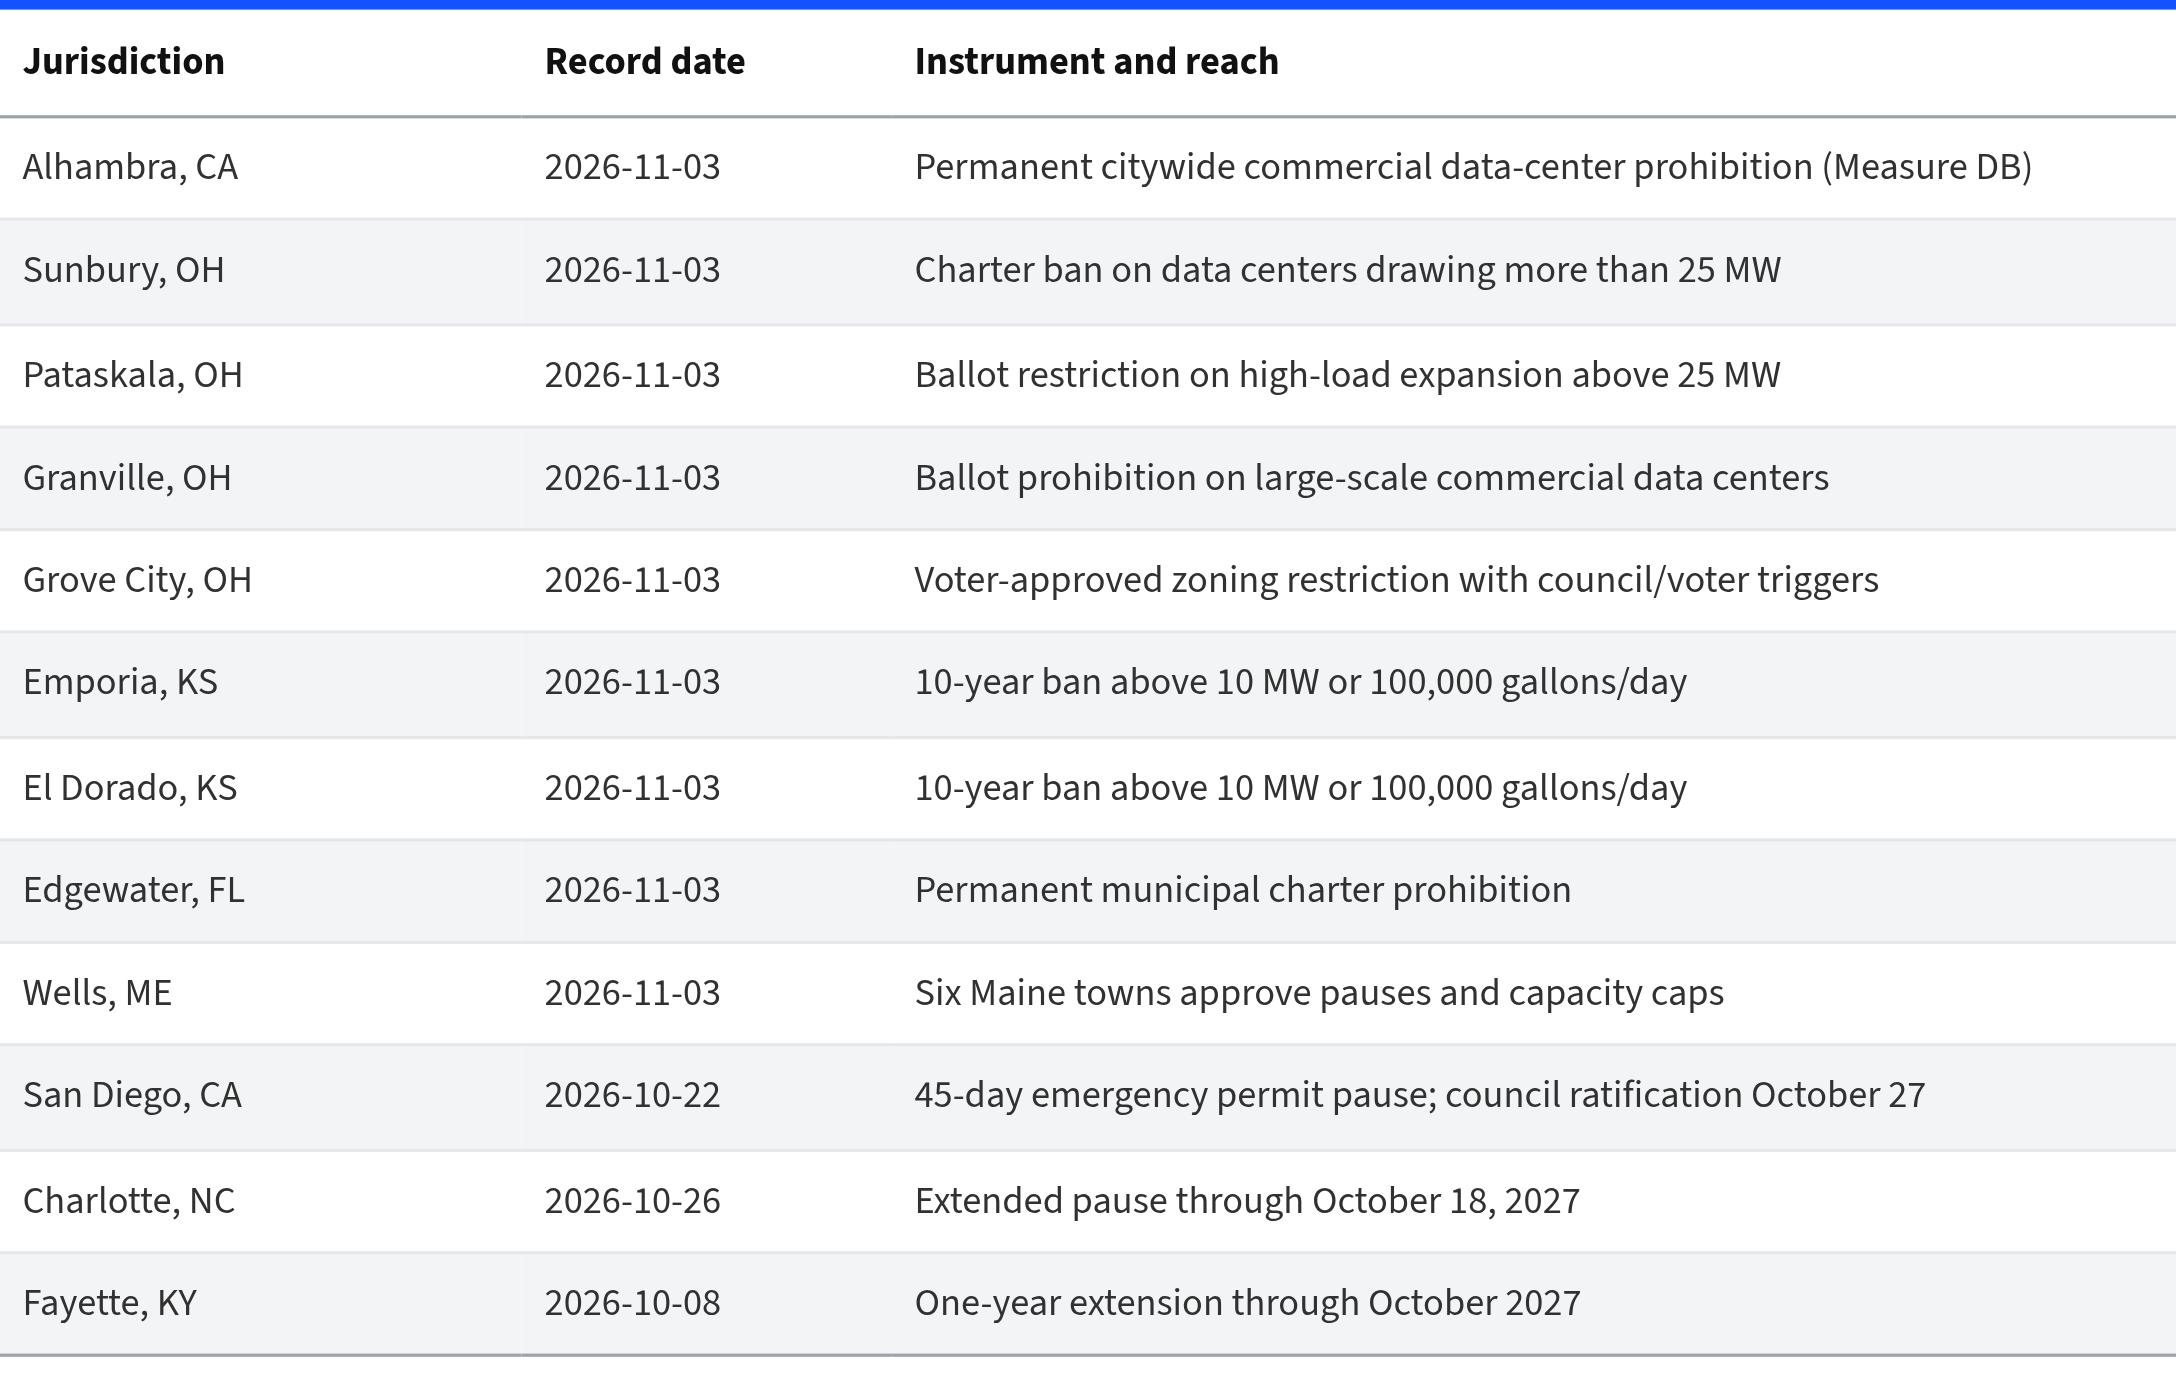
Beyond the ballot box, council chambers have played an active role. Charlotte extended its moratorium into October 2027. Lexington-Fayette stripped principal-use zoning while extending its freeze on the same horizon. San Diego ratified a forty-five-day emergency pause after opposition to a large Naval Information Warfare Systems Command-linked campus. Brighton, Colorado, doubled its freeze to a full year. Anyone who has sat through township meetings in Michigan or Ohio since spring will recognize the rhythm: a hearing fills, a staff report asks for time, and the calendar becomes the veto.12
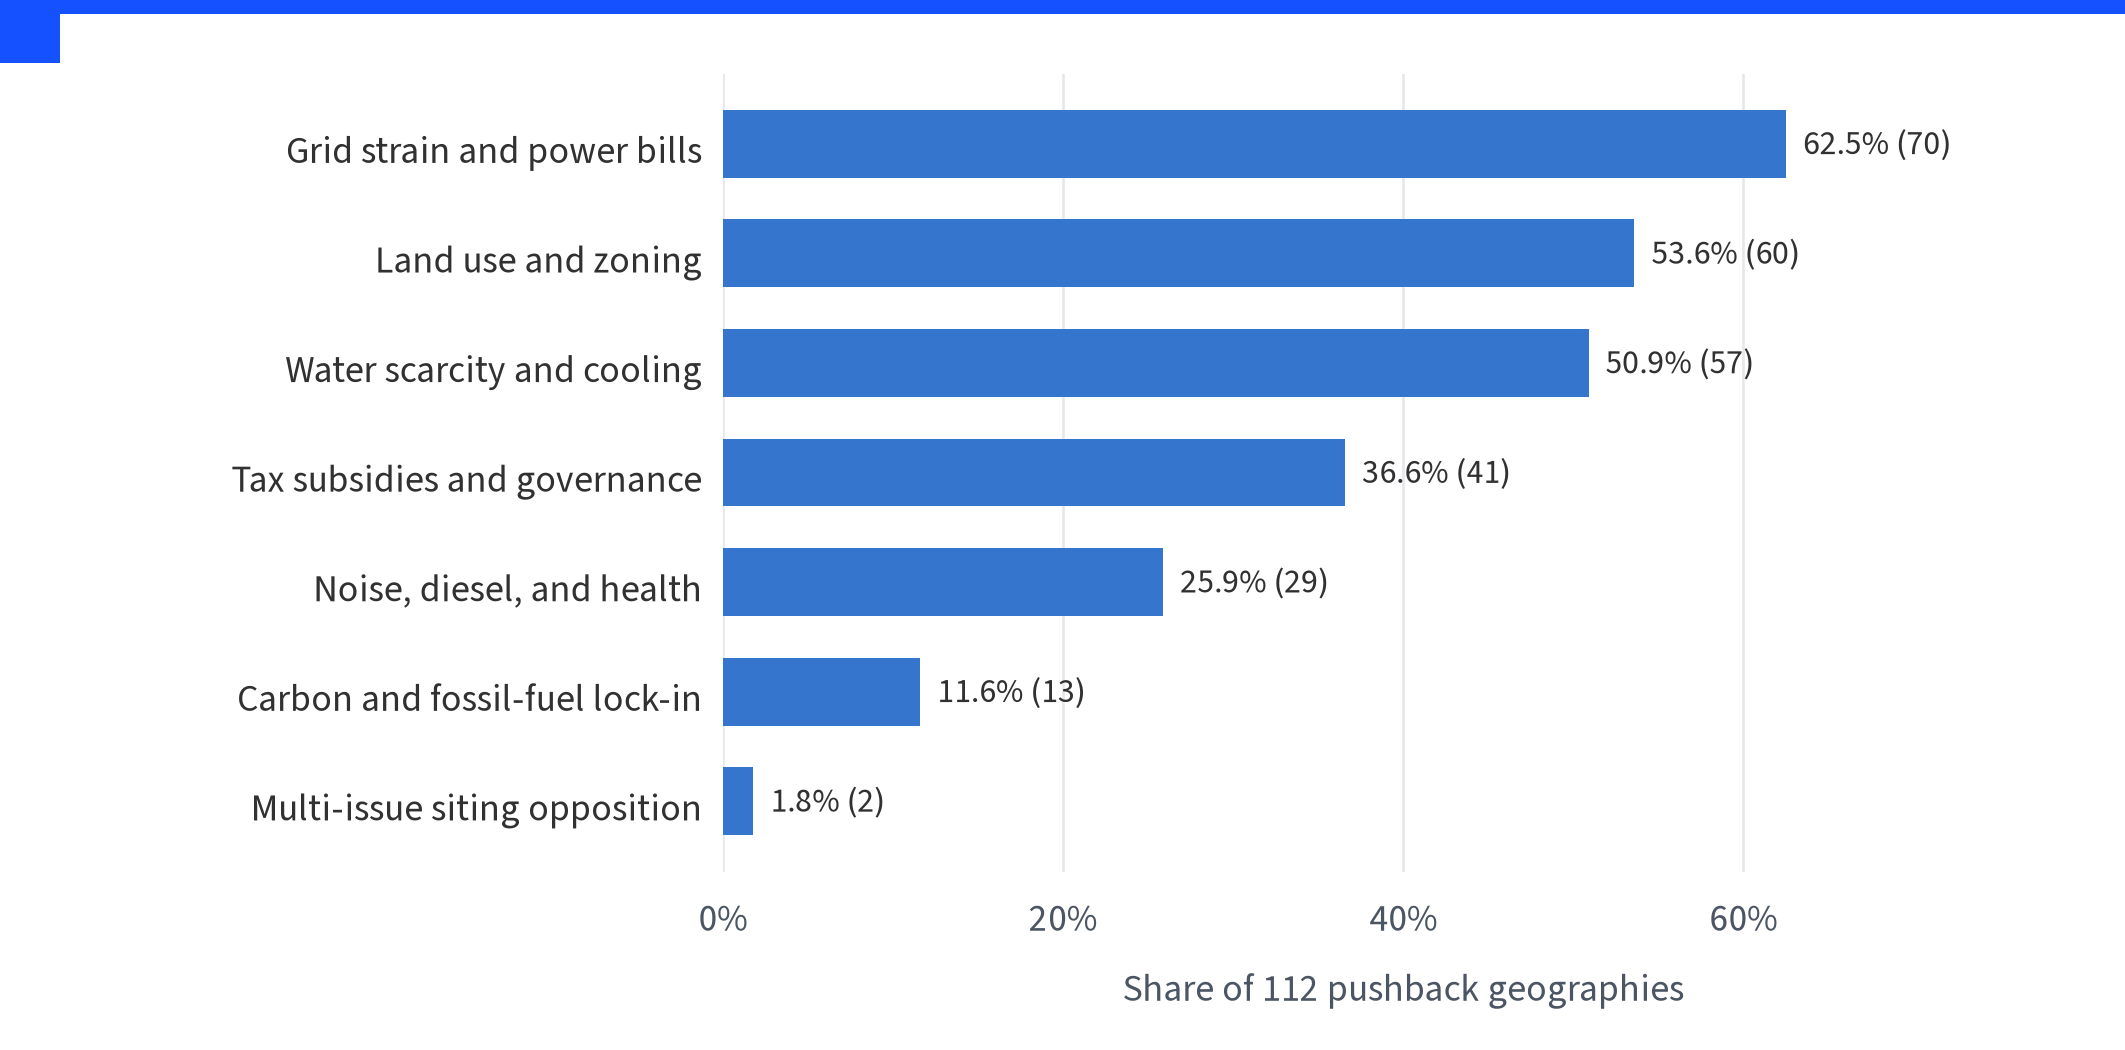
Ask what people say they are protecting and the map stops looking like an anti-tech fashion. Grid strain, transmission constraints, and residential power bills appear in 70 of 112 geographies, or 62.5 percent. Land use, farmland, and residential zoning follow at 53.6 percent. Water scarcity and cooling demand sit at 50.9 percent. Tax subsidies and secrecy, noise and diesel backup, and carbon lock-in trail those three.13
Statehouses are not absent. They mostly write conditions rather than pauses. California’s seven signed statutes are the clearest recent example: special tariffs and cost-causation rules for large loads, California Environmental Quality Act treatment, water-supply assessments, and disclosure of water use, cooling efficiency, and utility load requests. They raise the price and paperwork of admission.4,8 Federal Energy Regulatory Commission large-load and co-location dockets, and Department of Energy interconnection initiatives, sit even farther from the municipal vote. They matter for how a connected project pays and operates. They rarely decide whether a township will take the site in the first place.
For developers, lenders, and utilities, the operational lesson is narrower than the politics. Site screening that stops at state statute or regional transmission organization queue position will miss the binding constraint in the Pause Belt. A parcel can clear a wholesale study and still fail a county board’s legislative calendar, a grading-permit freeze, or a charter amendment voters have already locked in. Layers that combine local posture with project coordinates, such as those on theAIxEnergy Map, are useful precisely because the veto has moved down a level.3
The Pause Belt will not stay fixed. Urgency ordinances expire. Some boards will replace freezes with permanent zoning; others will let the clock run out and reopen the window. A few jurisdictions may decide that ratepayer and water rules are enough, and that outright pauses were only a bridge. What November 3 showed is how quickly a temporary tool becomes a permanent preference when voters get the ballot. Counting instruments is still not the same as counting lost megawatts. But for now it is the clearest way to see where permission is being withheld, and by whom.
Notes
- Ballotpedia listed 41 local measures; The GridSight summarized 39 reported with 38 going toward limits, https://thegridsight.com/data-center-votes-2026. Ohio results for Sunbury, Pataskala, and Granville reported by 10TV, https://www.10tv.com/article/news/politics/elections/ohio-election-results-voters-turn-down-data-centers/530-65672138-7004-4f40-a469-2b84b44719dc. All results unofficial until certified. ↩
- CNBC, “Data center ballot measures 2026 midterm,” November 4, 2026, https://www.cnbc.com/2026/11/04/data-center-ballot-measures-2026-midterm.html, citing Ballotpedia’s 41 measures in 10 states and Harwood, N.D., as the reported exception. Fortune reported 21 Ohio measures across 18 municipalities the same day. ↩
- AIxEnergy, “AIxEnergy Map,” policy-constraints layer (schema 2.1.0, as_of November 5, 2026) and companion Policy & Pushback Summary version 2.4.0, https://map.aixenergy.io/. The Midwest–Mid-Atlantic Pause Belt tint is an editorial annotation on the cultivated layer, not a legal boundary. ↩
- AIxEnergy, Policy & Pushback Summary, dataset version 2.4.0, as of November 5, 2026 (tables 1A–1B and posture meta counts: 1,195 instruments; pause 930; pending 76; conditional 55; monitoring 40; historical 94; local/county share 94.0 percent). Cell-verified against the companion workbook before figure render. ↩
- AIxEnergy, Policy & Pushback Summary 2.4.0, table 2A (moratoria by tier): local active total 507 (454 initial + 53 extended); county active total 421 (368 + 53); state active 1; federal/national active 1. ↩
- “At least 138 Ohio municipalities and townships have active moratoriums on data centers as of Sept. 17,” as reported by 10TV / Ohio Capital Journal, September 19, 2026, https://www.10tv.com/article/tech/ohio-active-moratoriums-data-centers/530-b253867f-c51d-4e9d-acbc-83565b480600. The article notes the true count is likely higher. AIxEnergy’s Ohio pause census (147) is above that floor and is a Map polygon count, not an independent government tally. ↩
- AIxEnergy, Policy & Pushback Summary 2.4.0, table 2B (top U.S. states by tracked instruments): Ohio 170 instruments / 147 active pauses; Michigan 134 / 122; Georgia 73 / 50; California 41 instruments with 13 active pauses and 11 conditional (seven signed state laws plus four permanent local bans). ↩
- Mackenzie Mays et al. reporting summarized in CalMatters, “California data centers hit with local regulation flood,” October 22, 2026, https://calmatters.org/economy/technology/2026/10/california-data-centers-hit-with-local-regulation-flood/, noting Governor Newsom signed seven statewide measures in September 2026. SAVRN’s California tracker lists AB 1577, AB 2383, AB 2469, AB 2619, SB 886, SB 887, and SB 1168 as signed September 21, 2026. ↩
- Loudoun County, “Loudoun Board Enacts Pause on Data Centers,” statement, September 16, 2026, https://www.loudoun.gov/DocumentCenter/View/222331/Statement---Loudoun-Board-Enacts-Pause-on-Data-Centers. Vote 7–1–1; pause covers Board consideration of certain legislative applications for data centers and substations; by-right/administrative cases continue. The Virginia Pulse reported the memorializing resolution deferred toward a November 17 meeting. ↩
- Montgomery County Council, Expedited Bill 19-26, signed and effective August 10, 2026, https://apps.montgomerycountymd.gov/ccllims/BillDetailsPage?RecordId=2907; signed text at https://apps.montgomerycountymd.gov/ccllims/DownloadFilePage?FileName=2907_1_26953_Bill_19-26E_Signed_20260810.pdf. Directs DPS not to accept, review, or issue building or grading permits for data centers ≥25 MW; sunsets after 18 months. ↩
- AIxEnergy, Policy & Pushback Summary 2.4.0, tables 3A and 4A (local and county posture breakdowns). Local: 507 active pauses of 621 instruments. County: 421 active pauses of 502 instruments. Permanent charter bans are classified Conditional in the posture layer. ↩
- AIxEnergy, Policy & Pushback Summary 2.4.0, table 7D (November 2026 pushback flashpoints), including Charlotte moratorium extension through October 18, 2027; Lexington-Fayette extension through October 2027; San Diego 45-day emergency moratorium ratified October 27, 2026; Brighton one-year freeze. ↩
- AIxEnergy, Policy & Pushback Summary 2.4.0, table 7C (pushback by grievance). Grid strain, transmission, and residential power bills: 70 of 112 geographies (62.5 percent). Land use: 60 (53.6 percent). Water: 57 (50.9 percent). Categories are multi-response and overlap. ↩
Bibliography
- 10TV. “Ohio Election Results: Voters Turn Down Data Centers.” November 2026. https://www.10tv.com/article/news/politics/elections/ohio-election-results-voters-turn-down-data-centers/530-65672138-7004-4f40-a469-2b84b44719dc.
- 10TV / Ohio Capital Journal. “At Least 138 Ohio Municipalities and Townships Have Active Moratoriums on Data Centers as of Sept. 17.” September 19, 2026. https://www.10tv.com/article/tech/ohio-active-moratoriums-data-centers/530-b253867f-c51d-4e9d-acbc-83565b480600.
- AIxEnergy. “AIxEnergy Map.” Policy-constraints layer, schema 2.1.0, as of November 5, 2026. https://map.aixenergy.io/.
- AIxEnergy. Policy & Pushback Summary. Dataset version 2.4.0, as of November 5, 2026. Tables 1A–1B, 2A, 2B, 3A, 4A, 7C, and 7D.
- CalMatters. “California Data Centers Hit with Local Regulation Flood.” October 22, 2026. https://calmatters.org/economy/technology/2026/10/california-data-centers-hit-with-local-regulation-flood/.
- CNBC. “Data Center Ballot Measures 2026 Midterm.” November 4, 2026. https://www.cnbc.com/2026/11/04/data-center-ballot-measures-2026-midterm.html.
- GridSight, The. “Data Center Votes 2026.” November 2026. https://thegridsight.com/data-center-votes-2026.
- Loudoun County. “Loudoun Board Enacts Pause on Data Centers.” Statement, September 16, 2026. https://www.loudoun.gov/DocumentCenter/View/222331/Statement---Loudoun-Board-Enacts-Pause-on-Data-Centers.
- Montgomery County Council. Expedited Bill 19-26. Signed and effective August 10, 2026. https://apps.montgomerycountymd.gov/ccllims/BillDetailsPage?RecordId=2907.