The International Energy Agency’s July 2026 Electricity Mid-Year Update identifies expanding data-center capacity as one of the structural forces accelerating global power demand. The IEA expects worldwide electricity consumption to grow 3.6 percent in 2026 and 3.8 percent in 2027, reaching approximately 30,700 terawatt-hours. Its more focused April assessment of energy and artificial intelligence estimates that data-center electricity consumption increased 17 percent in 2025, while consumption by AI-focused facilities increased 50 percent. The agency’s central case now places global data-center electricity demand at approximately 950 terawatt-hours in 2030—nearly twice the 485 terawatt-hours consumed in 2025. (International Energy Agency 2026a, 2026b). (IEA)
 Brandon Owens
The scale of the buildout has made electricity supply, grid interconnection, generation equipment, transformers, land, and capital first-order development constraints. Cooling climate receives less attention. It is often addressed after a site has entered the development pipeline, when the developer begins specifying chillers, cooling towers, dry coolers, economizers, or liquid-cooling systems.
That sequencing is increasingly expensive. Nearly every megawatt consumed by information-technology equipment ultimately becomes heat. The amount of heat produced is principally determined by the computing load, but the energy, water, equipment, and infrastructure required to remove that heat depend partly on the climate outside the building. Outdoor dry-bulb temperature affects sensible heat rejection and air-cooled equipment. Wet-bulb temperature affects cooling towers and evaporative systems. Atmospheric moisture affects enthalpy, condensation control, and economizer operation. Extreme heat affects equipment sizing, redundancy, and resilience.
Climate does not determine whether a site is viable. Power availability, interconnection timing, fiber, latency, land, water rights, permitting, and customer demand can overwhelm any climatic advantage. But climate influences the amount of infrastructure that must be built and operated around the IT load. At the scale of the AI infrastructure pipeline, even a modest difference in cooling-system performance can translate into tens of megawatts of additional grid demand and hundreds of millions of dollars in life-cycle operating costs.
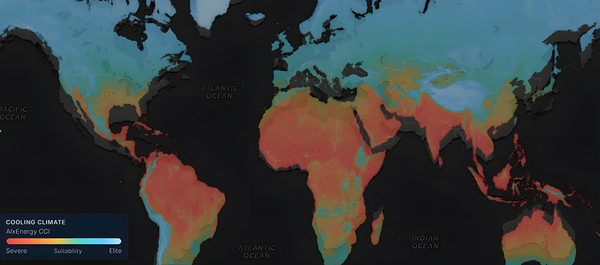
The AIxEnergy Cooling Climate Index, or CCI, was developed to place this variable into the early-stage siting process. The global CCI map layer it is available through the AIxEnergy Map to free and paid subscribers.
What the Cooling Climate Index measures
The CCI map overlay allows developers, utilities, investors, equipment suppliers, and policymakers to compare the broad thermal characteristics of locations against AIxEnergy’s global project, infrastructure, water, hazard, and policy data. It is turned off by default and is intended to be activated when thermal conditions are relevant to the analysis.
The current production version assigns each land cell a score between zero and 100. Higher scores indicate lower modeled climatic cooling burden. The public map organizes the continuous field into five interpretive bands:
AIxEnergy Cooling Climate Index
CCI Score Interpretation
Higher scores indicate lower modeled climatic cooling burden.
| CCI score | Interpretation |
|---|---|
| 80–100 | Elite cooling climate |
| 60–80 | Favorable |
| 40–60 | Moderate |
| 20–40 | Challenging |
| 0–20 | Severe thermal stress |
CCI is a climate-derived screening measure, not a prediction of facility PUE, WUE, cooling cost, or site viability.
The index is derived from WorldClim 2.1 monthly mean temperature and vapor-pressure data at 2.5 arc-minute resolution—approximately 4.5 kilometers at the equator. The source climatology covers 1970–2000. For each cell, CCI calculates three climatic proxies:
- An annual cooling-degree-day measure based on monthly temperatures above 18°C.
- The highest monthly mean temperature.
- Average annual vapor pressure.
The components are normalized using fixed physical stretches and combined into a climatic-challenge score. Cooling degree days receive a 55 percent weight, peak monthly heat 25 percent, and vapor pressure 20 percent. The challenge score is then reversed and transformed to produce the zero-to-100 CCI result.
The use of fixed rather than percentile-based normalization is important. A score does not simply indicate that a location is cooler than a certain percentage of the world. The same underlying climatic values will generate the same score in subsequent builds, assuming the methodology does not change. This makes CCI more useful for longitudinal comparison than an index whose rankings move whenever the comparison population changes.
The technical methodology includes illustrative—not location-specific—examples. A synthetic cool maritime climate produces a CCI of 68.2, while a temperate climate produces 55.0. A hot, dry climate produces 19.1, and a hot, humid climate produces 2.9. These examples show the index’s directional behavior: sustained heat is penalized heavily, and humidity creates an additional burden where high temperature and moisture coincide. They do not establish a direct relationship between a given CCI score and a facility’s power usage effectiveness, or PUE.
That distinction is essential. CCI is a climate-derived screening index. It is not a facility-performance model.
Why the economics become material so quickly
PUE is the ratio of total facility electricity consumption to IT electricity consumption. A facility with 100 megawatts of IT load and a PUE of 1.30 requires approximately 130 megawatts of total facility power at full load. The additional 30 megawatts covers cooling, power conversion, distribution losses, pumps, fans, lighting, and other non-IT loads.
Climate influences only part of this overhead. Facility design, utilization, redundancy, commissioning, operating temperatures, controls, cooling architecture, and equipment efficiency remain critical. Lawrence Berkeley National Laboratory’s national modeling explicitly treats PUE and water usage effectiveness as functions of cooling system, facility type, operational practice, weather, and other infrastructure—not as functions of outdoor temperature alone. (Shehabi et al. 2024). (LBL ETA Publications)
Nevertheless, the economic value associated with small PUE differences is large enough that climate should be evaluated before a region is locked into the development portfolio.
The following calculation assumes a 90 percent IT load factor and an electricity price of $70 per megawatt-hour. It does not represent a CCI-to-PUE conversion. It shows the financial exposure associated with a 0.10 PUE difference that climatic conditions, cooling architecture, or operating practices could help create or avoid.
Data-center efficiency economics
The Annual Cost of a 0.10 PUE Difference
Small changes in facility efficiency become financially and operationally significant as IT capacity scales.
IT capacity
25 MW
Annual electricity cost
$1.38M
- Annual IT electricity
- 197.1 GWh
- Energy from 0.10 PUE
- 19.7 GWh
- Additional facility demand
- 2.5 MW
IT capacity
100 MW
Annual electricity cost
$5.52M
- Annual IT electricity
- 788.4 GWh
- Energy from 0.10 PUE
- 78.8 GWh
- Additional facility demand
- 10 MW
IT capacity
500 MW
Annual electricity cost
$27.59M
- Annual IT electricity
- 3,942 GWh
- Energy from 0.10 PUE
- 394.2 GWh
- Additional facility demand
- 50 MW
For a 500-megawatt AI campus, a 0.10 PUE difference represents nearly 400 gigawatt-hours per year. At the illustrative price used above, the difference is approximately $276 million over ten years before escalation, discounting, maintenance, demand charges, or carbon costs. A 0.20 difference would double those values.
The grid implication may be as important as the energy bill. At 500 megawatts of IT load, moving from a PUE of 1.20 to 1.40 increases full-load facility demand from 600 to 700 megawatts. That additional 100 megawatts can affect interconnection studies, substation sizing, transformer procurement, backup generation, transmission upgrades, security deposits, minimum bills, and the amount of capacity a utility must reserve.
CCI cannot tell a developer whether the realized PUE will be 1.20 or 1.40. It can indicate where climatic conditions are likely to place greater pressure on the thermal design and where detailed modeling has the highest economic value.
The national context reinforces the point. Lawrence Berkeley National Laboratory’s 2026 update estimates that U.S. data centers could consume approximately 649 terawatt-hours in 2030 in its reference case, with a compounded uncertainty range of 521–843 terawatt-hours. That would represent between 9.5 and 15.3 percent of U.S. electricity consumption. At that scale, the non-IT efficiency of the fleet is no longer an internal operating issue. It is a material grid-planning variable. (Smith et al. 2026). (Energy Technologies Area)
CCI is most valuable when paired with a cooling architecture
“Free cooling” is frequently treated as a climatic attribute. In practice, it is a system-design outcome. Favorable weather creates the opportunity to reduce or avoid compressor-based refrigeration, but the number of usable hours depends on equipment temperatures, approach temperatures, filtration, humidity controls, heat exchangers, and facility operating limits.
For air-side economization, the relevant variables may include dry-bulb temperature, dew point, enthalpy, air quality, wildfire smoke, salt, particulates, and corrosion risk. A cool climate does not necessarily provide usable outdoor air.
For water-side economization, wet-bulb temperature and chilled-water set points are more important than annual average temperature. The U.S. Department of Energy notes that water-side economizers are generally best suited to climates with at least 3,000 hours per year below a 55°F wet-bulb temperature, although actual performance depends on chilled-water temperatures and system configuration. DOE also emphasizes that higher chilled-water supply temperatures can increase economizer hours and reduce chiller operation. (U.S. Department of Energy 2024, 17–19). (The Department of Energy's Energy.gov)
Dry coolers are governed largely by dry-bulb temperature and the temperature at which heat is rejected. Hot, dry climates can improve the effectiveness of adiabatic assistance but may impose a substantial burden on fully dry systems during peak conditions.
Liquid cooling changes the equation again. By capturing heat closer to the processor and operating with warmer facility-water temperatures, direct-to-chip and other liquid systems can reduce server and room-fan energy and expand the range of conditions under which compressors can be bypassed. DOE guidance notes that higher water-temperature classes can facilitate dry cooling and additional water-side economization. (U.S. Department of Energy 2024, 20–22). (The Department of Energy's Energy.gov)
This matters because AI is pushing rack density beyond the practical limits of many conventional air-cooling configurations. The IEA reports that AI server power density increased elevenfold between 2020 and 2025 and could increase another fourfold by 2027. The climate remains relevant, but the mechanism changes: the question becomes whether a site can reject heat from a warm-water liquid loop without extensive mechanical refrigeration or water consumption, rather than whether outdoor air can directly cool a conventional server room. (International Energy Agency 2026b). (IEA)
CCI version 4 is deliberately technology-neutral. Developers should therefore avoid interpreting a high score as proof that one particular cooling design will work. Instead, the score should initiate a technology-specific question:
Given this climate, rack density, water constraint, and allowable facility-water temperature, which cooling architecture minimizes total delivered cost and operational risk?
The water trade-off cannot be separated from cooling climate
Cooling decisions frequently exchange electricity consumption for water consumption. Evaporative systems can reduce compressor energy but increase on-site water use. Air-cooled or fully dry systems can reduce direct water use while increasing electricity demand, equipment size, or peak-temperature exposure.
LBNL estimated that average site water usage effectiveness across U.S. data centers was slightly above 0.36 liters per kilowatt-hour of IT electricity in 2023 and could rise to approximately 0.45–0.48 liters per kilowatt-hour by 2028 as the facility mix and cooling technologies change. The report cautions that low site WUE is not automatically preferable because waterless systems may consume more electricity, which can itself carry upstream water and emissions impacts. (Shehabi et al. 2024, 44–48). (LBL ETA Publications)
The scale is again material. A 100-megawatt IT facility operating at a 90 percent load factor consumes approximately 788 million kilowatt-hours of IT electricity annually. At a site WUE of 0.36 liters per kilowatt-hour, annual on-site water use would be approximately 284 million liters, or 75 million gallons. At 0.45–0.48 liters per kilowatt-hour, it would approach 94–100 million gallons.
Those numbers are illustrative national-model values, not predictions for a particular site. They show why a cooling-climate layer should always be interpreted alongside water stress, water rights, drought exposure, treatment requirements, wastewater-discharge constraints, and local political conditions.
A cool location with a high CCI may allow extensive dry or economizer operation and reduce both electricity and water exposure. A hot, dry location may offer good evaporative potential but create a conflict between low energy use and scarce water. A hot, humid location can be challenging on both dimensions, reducing evaporative effectiveness while increasing the mechanical-cooling burden. A sophisticated siting model must therefore consider the energy-water frontier rather than optimize PUE or WUE independently.
This is one reason CCI is embedded within map.aixenergy.io rather than published as a standalone ranking of “best” locations. Its decision value comes from intersection: cooling climate against water, cooling climate against grid access, and cooling climate against the known geography of project development.
How developers should use CCI
CCI is most useful in four stages of development.
First, use it to screen portfolios, not approve sites. A developer comparing dozens or hundreds of candidate regions can use the overlay to identify broad climatic differences and to avoid treating all megawatts as thermally equivalent. A project in a low-CCI region should not automatically be removed, but its development budget should include earlier cooling, water, and resilience work.
Second, inspect the underlying drivers. Two locations can have similar composite scores for different reasons. One may have moderate annual heat but high humidity. Another may be dry but experience a severe hot season. These conditions can favor different architectures. The composite score is the entry point; the temperature and moisture components explain the score.
Third, translate the climate signal into a design-specific financial sensitivity. Developers should model multiple cooling configurations using modern hourly weather data and explicit operating assumptions. Outputs should include annual cooling electricity, peak auxiliary demand, economizer hours, water use, chiller and dry-cooler sizing, heat-wave performance, and the capital cost of redundancy. The resulting scenarios should be converted into net present cost and site-power requirements.
Fourth, integrate the result into the broader siting decision. A lower cooling burden may justify a modest land or transmission premium, but only within limits. A high-CCI location that cannot obtain grid service for seven years is not superior to a moderate-CCI location that can energize in three. Conversely, a low electricity tariff can be misleading if the climate requires substantial additional infrastructure or if the tariff excludes demand charges, infrastructure contributions, or future cost-allocation risk.
A disciplined workflow is therefore:
- Use CCI to identify regional thermal differences.
- Overlay power, projects, water, hazards, and policy constraints.
- Select the cooling technologies appropriate to the expected rack density.
- Obtain modern hourly weather and ASHRAE design conditions.
- Calculate technology-specific cooling energy, water, and peak demand.
- Price those outcomes over the expected asset life.
- Stress-test the design against extreme heat and a changing climate.
The limits of the CCI
The current CCI is intentionally a screening construct. It is not a predictor of facility PUE, WUE, cooling cost, reliability, or project success. Its source climatology covers 1970–2000, while the World Meteorological Organization’s current standard normal is 1991–2020. In regions that have warmed materially, the current index may overstate present thermal favorability. (World Meteorological Organization)
Monthly averages also suppress short heat waves, diurnal variation, and the coincidence of high temperature and humidity. The CCI vapor-pressure component improves upon a temperature-only map, but annual mean vapor pressure is not equivalent to hourly wet-bulb temperature, dew point, or moist-air enthalpy. The selected weights and normalization constants are calibrations, not parameters fitted to a representative dataset of operating data centers.
A future CCI architecture could distinguish dry-bulb economizer potential, wet-bulb economizer potential, enthalpy limits, dry-cooling burden, extreme-heat exposure, climate trend, water stress, and confidence. It could also be validated against measured or simulated cooling energy after controlling for facility design.
For developers, the practical conclusion is simpler. Cooling climate should not be allowed to enter the project only after the location has effectively been selected. Nor should it be elevated above power, interconnection, water, or market access.
It belongs in the first screen because its economic consequences compound with scale. At 25 megawatts, a thermal disadvantage may be manageable. At 500 megawatts, the same disadvantage can consume the output of a small power plant, alter the interconnection request, and create a nine-figure life-cycle exposure.
References
AIxEnergy. 2026. AIxEnergy Cooling Climate Index (CCI): Technical Methodology, Scientific Basis, Validation Protocol, and Deployment Specification. Technical Methodology Version 1.0. July 28, 2026.
ASHRAE. 2021. Thermal Guidelines for Data Processing Environments. 5th ed., rev. and expanded. ASHRAE Datacom Series, Book 1. Peachtree Corners, GA: ASHRAE.
Fick, Stephen E., and Robert J. Hijmans. 2017. “WorldClim 2: New 1-km Spatial Resolution Climate Surfaces for Global Land Areas.” International Journal of Climatology 37 (12): 4302–15. doi:10.1002/joc.5086.
International Energy Agency. 2026a. Electricity Mid-Year Update 2026. Paris: International Energy Agency. Published July 23, 2026.
International Energy Agency. 2026b. Key Questions on Energy and AI. Paris: International Energy Agency. Published April 16, 2026.
Shehabi, Arman, Sarah Josephine Smith, Alex Hubbard, Alexander Newkirk, Nuoa Lei, Md AbuBakar Siddik, Billie Holecek, Jonathan G. Koomey, Eric R. Masanet, and Dale A. Sartor. 2024. 2024 United States Data Center Energy Usage Report. LBNL-2001637. Berkeley, CA: Lawrence Berkeley National Laboratory. doi:10.71468/P1WC7Q.
Smith, Sarah Josephine, Alex Hubbard, Alexander Newkirk, Mohan Ganeshalingam, Billie Holecek, Dale A. Sartor, Michael Mills, and Arman Shehabi. 2026. United States Data Center Energy Usage Report: 2025 Update. Berkeley, CA: Lawrence Berkeley National Laboratory. doi:10.71468/P1RP4F.
Van Geet, Otto, and David Sickinger. 2024. Best Practices Guide for Energy-Efficient Data Center Design. Revised July 2024. U.S. Department of Energy, Federal Energy Management Program.
WorldClim. n.d. “Historical Climate Data.” WorldClim Version 2.1. Accessed July 28, 2026.
World Meteorological Organization. n.d. “WMO Climatological Normals.” Accessed July 28, 2026.